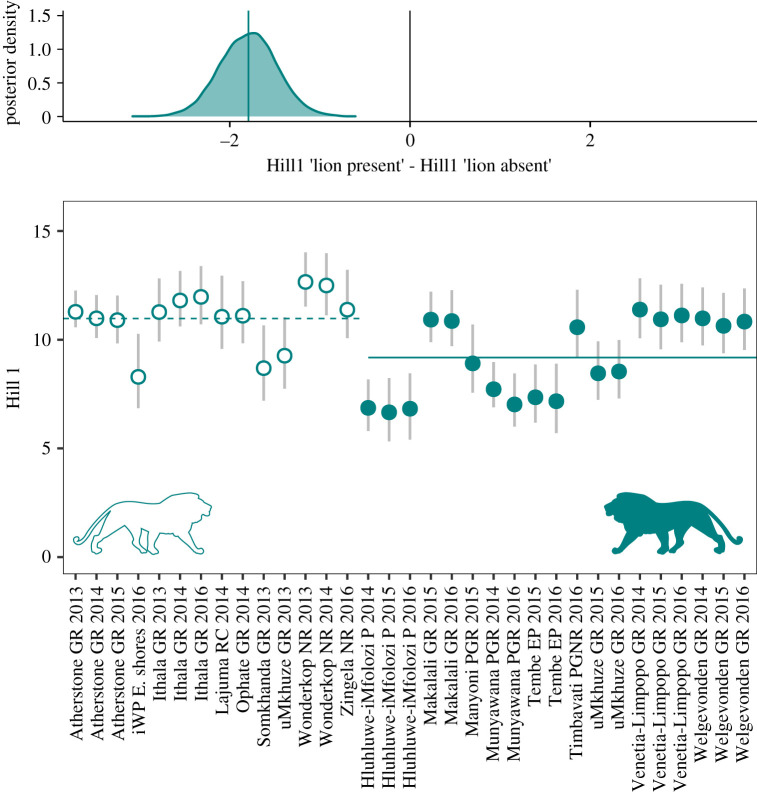
Figure 4.
Reserve-by-year-specific mesocarnivore diversity expressed as occupancy-based Shannon diversity Hill number (q = 1, the Shannon entropy exponentiated). Horizontal bars represent Hill number's means across surveys. Points are posterior distribution means, and error bars represent 95% Bayesian credible intervals. Filled and open symbols represent estimates in the presence and absence of lions, respectively. (Online version in colour.)

