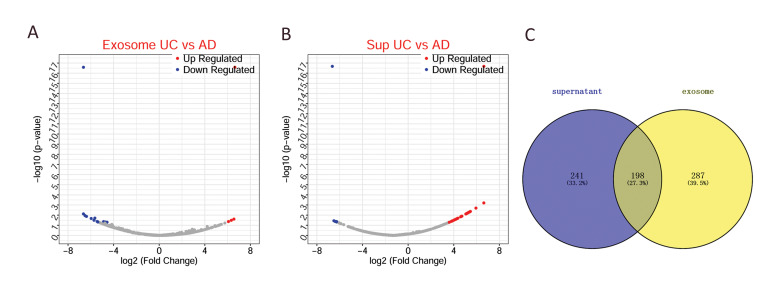
Fig.3.
DEPs between exosomes derived from the UC- and AD- MSCs. A. The volcano figure of the DEPs between exosomes from the UC- and AD- MSCs. B. The volcano figure of the DEPs between supernatant from the UC- and AD- MSCs. C. Venn diagram of the DEPs. Blue and red dots represent downregulated and upregulated proteins, respectively. The gray color represents the normally regulated proteins, abscissa is log2 FC, and ordinate is log10P. AD; Adipose tissue, UC; Umbilical cord, DEPs; Differentially expressed proteins, and MSCS; Mesenchymal stem cells.

