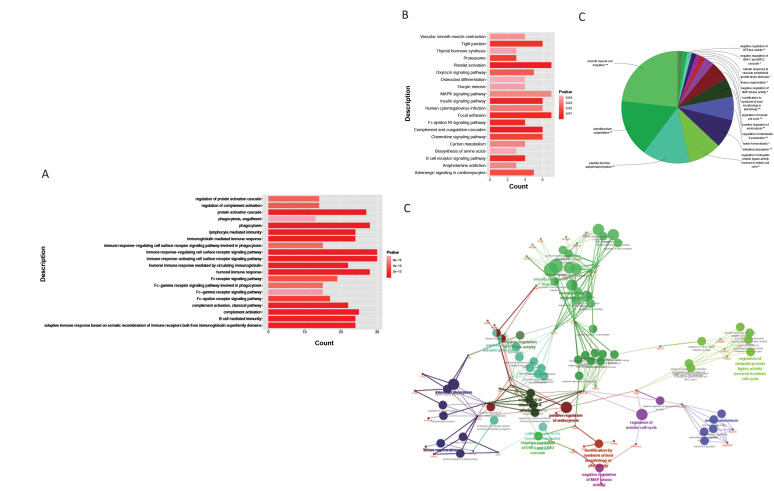
Fig.5.
The functional enrichment analyses of the DEPs. A. The histogram of GO enrichment analysis based on the DEPs. B. KEGG pathway of DEPs. The vertical axis in A and B is the functional item and the horizontal axis is the count, which is the number of enriched proteins. The deeper the red color, the smaller the P value, indicating a higher significance. C. The Pie chart of functional classification. Different colors represent different types of functions, and the labels are representative function items. D. The network of ClueGO function. The red label is the target protein and the other dots are GO functional terms. The two-point line represents the correlation between different functions. Different colors represent different groups, and the smaller the P value, the larger the dot. Meanwhile the larger the kappa coefficient, the thicker the line. DEPs; Differentially expressed proteins, Go; Gene ontology, and KEGG; kyoto encyclopedia of genes and genomes.

