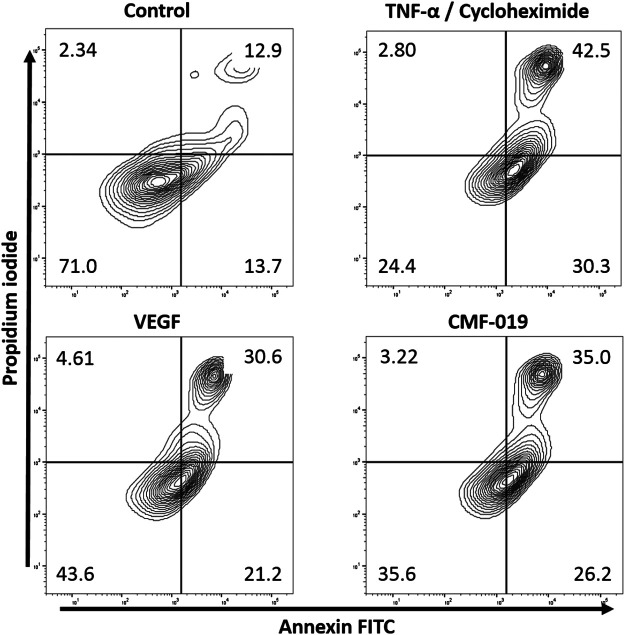
FIGURE 2.
Representative contour plot flow data of human PAECs induced to apoptosis with TNFα/CHX and rescued with either rhVEGF or CMF-019 at 1 µM. Cells were incubated in EGM-2 with 10% FBS (control); EGM-2 with 2% FBS and TNFα/CHX (TNFα/CHX) treatment for 5hrs to induce apoptosis before rhVEGF (10 ng/ml) or CMF-019 (1–10 μM) was added for a further 18 h. PI staining is displayed on the x-axis and annexin-V FITC staining on the y-axis. The percentage of cells in each quadrant are shown in the corners of the quadrant.

