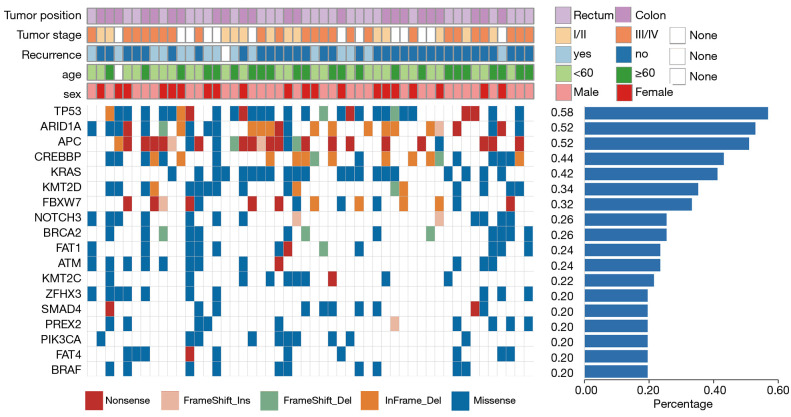
Figure 1.
Mutation landscape of 18 common high frequency mutation genes in The Cancer Genome Atlas (TCGA) and clinical cases. The upper side shows the details of clinical information of each patient. The lower panel illustrates the genetic alterations, with the different colors representing different mutation types. The histogram on the right shows the frequency of mutation genes in 50 clinical patients.

