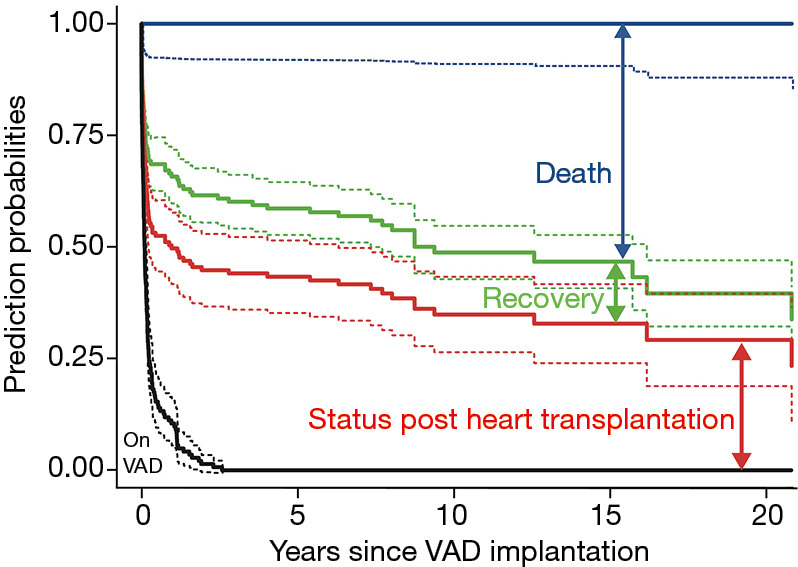
Figure 5.

Stacked transition probabilities derived from multistate estimation for time-related events of children with heart failure supported with VAD. The continuous lines show the estimations, the dashed lines their confidence limits. Numbers of patients at risk in a certain state may be read from the previous figures; the model shown considers all survivors at the time shown in the x-axis. The vertical distance between a line and the line underneath shows the fraction of patients that can be expected to be in the state described in the figure at the time given on the x-axis. To find the percentage of patients that corresponds to the vertical distance, shift the distance arrow to the bottom of the y-axis on the bar top, the scale indicates the percentage of patients being in this state. For example, at 15 years about 13% of the children who needed VAD support were in the state of recovery. Risk factors for the transitions from one state to another are illustrated. State wise risk factors derived from this model are described in Table 5. VAD, ventricular assist device.
