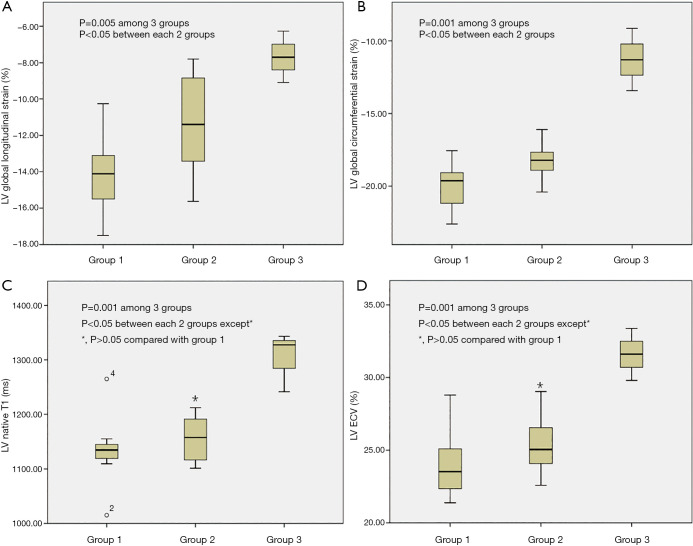
Figure 2.
Box plots comparing strain indices and T1 mapping values between different Fabry disease stage groups. (A) LV global longitudinal strain was significantly different among three Fabry disease groups (P=0.005) and between each two groups (all P<0.05). (B) LV global circumferential strain was significantly different among three Fabry disease groups (P=0.001) and between each two groups (all P<0.05). (C) LV native T1 value was significantly different among three Fabry disease groups (P=0.001), but showed no significant difference between group 1 and group 2 (*, P=0.461). (D) LV ECV was significantly different among three Fabry disease groups (P=0.001) but showed no significant difference between group 1 and group 2 (*, P=0.340).

