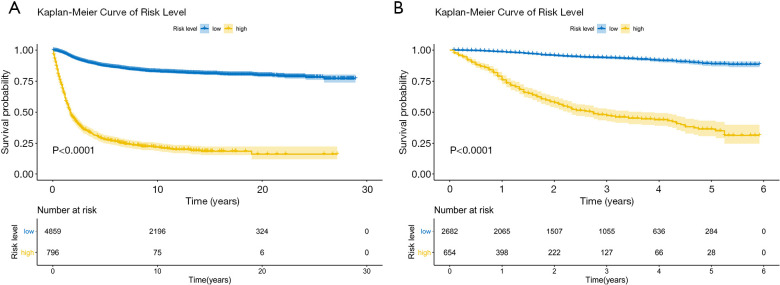
Figure 6.
Kaplan-Meier survival curve in patients with UAC. (A) Kaplan-Meier survival curve according to risk score of the prediction model in the development cohort. (B) Kaplan-Meier survival curve according to risk score of the prediction model in the temporal validation cohort. By calculating the risk score for each patient based on the model in the development and temporal validation cohort, patients were classified into the high- and low-risk groups with the same cut-off values. The high‐risk group was associated with an increased probability of CSD compared with the low-risk group (P<0.001). UAC, uterine cervical adenocarcinoma; CSD, cancer-specific death.

