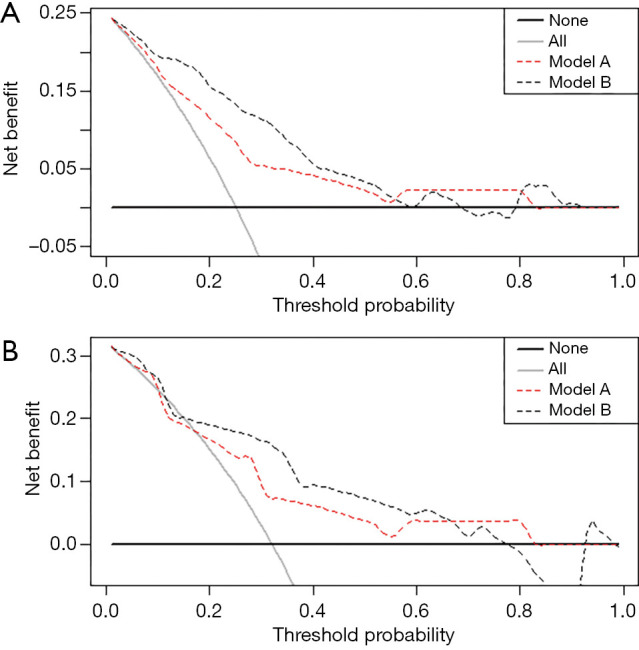
Figure 4.

Decision curves. (A) Development group, (B) validation group. Draw the decision curve with the net benefit as vertical axis and the threshold probability as horizontal axis. The solid black line represents the net benefit when all patients are considered as not developing outcome (intraoperative blood loss ≥2,500 mL). The solid grey line represents the net benefit when all patients are considered as developing outcome. The preferred model is the model with the highest net benefit.
