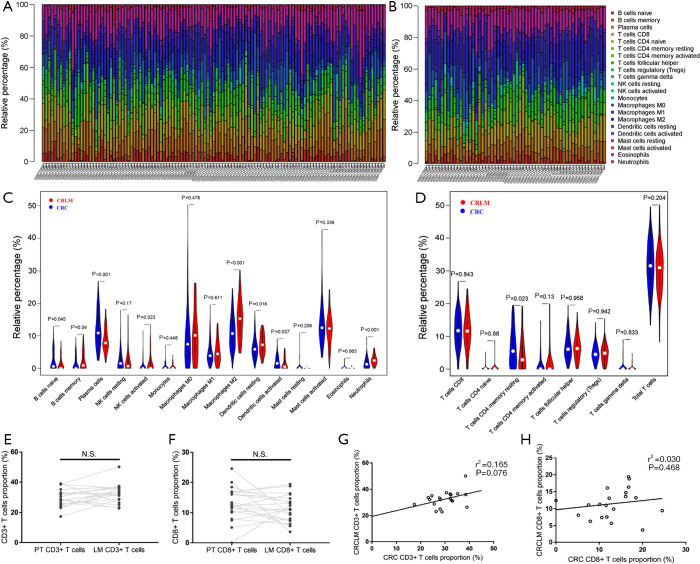
Figure 5.
The proportions and correlations of immune cells between colorectal primary tumors and metastases analyzed by GEO dataset. (A,B) Bar graphs of the proportions of 22 subpopulations of immune cells obtained from 117 stage IV CRC primary sites (A) and 58 CRLM metastatic sites (B). (C,D) Violin graph of the proportions of immune cells between primary tumors and metastatic sites: (C) violin graph of the proportions of immune cells except for T cells; (D) violin graph of the proportions of T lymphocytes. (E,F,G,H) Difference and correlation of CD3+ and CD8+ T cell proportions between primary tumors and liver metastases in data collected from GEO: (E,F) difference in CD3+ (E) and CD8+ (F) T cell proportions between primary tumors and liver metastases, the dark grey dots represent the proportion of CD3+ T cells and CD8+ T cells of each case in primary tumor and liver metastasis. The proportions of CD3+ T cells and CD8+ T cells infiltrated in primary tumor and corresponding liver metastasis were connected by light grey lines (CD3+: P=0.086, CD8+: P=0.282). (G,H) Correlation of CD3+ (G) and CD8+ (H) T cell proportions between primary tumors and liver metastases. CRC, colorectal cancer; CRLM, colorectal cancer liver metastases; GEO, Gene Expression Omnibus.

