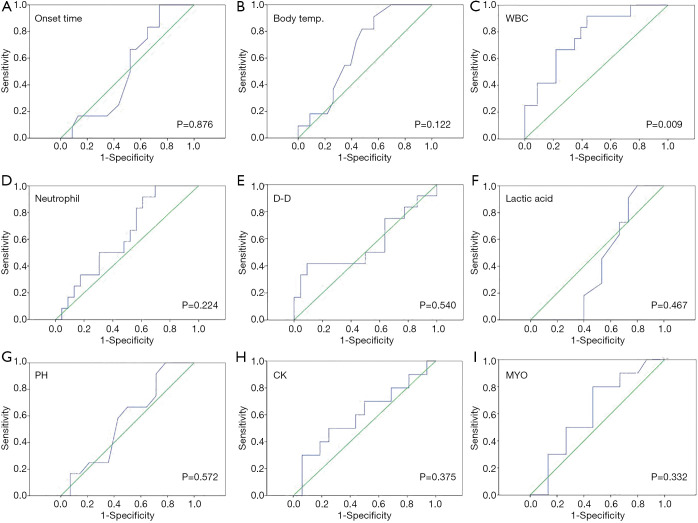
Figure 2.
Receiver operating characteristic curves of indicators for intestinal necrosis. (A) Shows receiver operating characteristic curves of onset time (P=0.876); (B) shows receiver operating characteristic curves of body temp (P=0.122); (C) shows receiver operating characteristic curves of WBC (P=0.009); (D) shows receiver operating characteristic curves of neutrophil (P=0.224); (E) shows receiver operating characteristic curves of D-D (P=0.540); (F) shows receiver operating characteristic curves of lactic acid (P=0.467); (G) shows receiver operating characteristic curves of PH (P=0.572); (H) shows receiver operating characteristic curves of CK (P=0.375). (I) shows receiver operating characteristic curves of MYO (P=0.332). WBC, white blood cell; D-D, D-dimer; PH, pondus hydrogenii; CK, creatine phosphokinase; MYO, myohemoglobin.

