
Fig. 5.
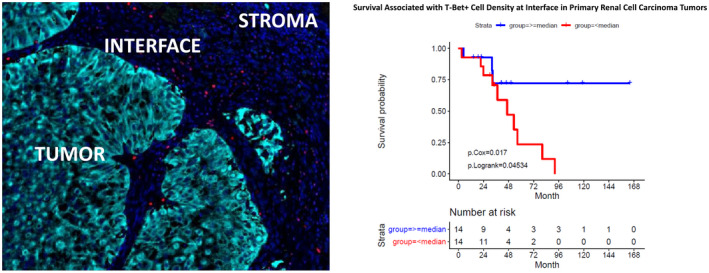
Distribution of T‐box protein expressed in T cells (T‐bet)+ cells (red) at the pan‐cytokeratin‐stained tumor‐ (cyan) and 4′,6‐diamidino‐2‐phenylindole (DAPI)‐stained stroma (dark blue) interface shown on immunofluorescence and correlation with survival after first dose of immunotherapy estimated using Kaplan–Meier survival analyses.