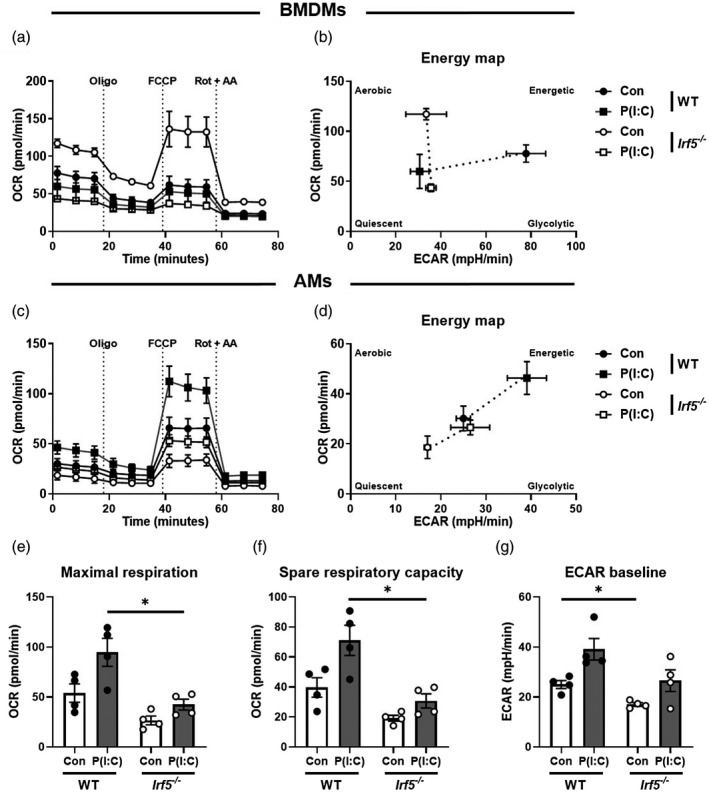
Fig. 2.

Interferon regulatory factor 5 (IRF5) controls airway macrophage (AM) metabolic responses to Toll‐like receptor (TLR)‐3 activation. (a) Analysis of the oxygen consumption rate of wild‐type (WT) or Irf5−/− macrophage–colony‐stimulating factor) (M‐CSF)‐differentiated bone marrow‐derived macrophages (BMDMs), stimulated with poly(I:C) or vehicle controls, during mitochondrial stress tests, assessed with sequential injection (dashed vertical lines) of the mitochondrial adenosine triphosphate (ATP)‐synthase inhibitor oligomycin (Oligo), the mitochondrial uncoupler carbonyl cyanide‐4‐(trifluoromethoxy)phenylhydrazone (FCCP) and inhibitors of the electron transport‐chain complexes I and III, rotenone and anti‐mycin A (Rot + AA). (b) Energy map of WT or Irf5−/− BMDMs, indicating four possible energy states; quiescent: the cell is not predisposed towards OxPhos or glycolysis; energetic: the cell utilizes both metabolic pathways; aerobic: the cell predominantly utilizes OxPhos; glycolytic: the cell predominantly utilizes glycolysis. (c) Analysis of the oxygen consumption rate of wild‐type (WT) or Irf5−/− AMs, stimulated with poly(I:C) or complete RPMI controls, during mitochondrial stress tests. (d) Energy map of WT or Irf5−/− AMs. (e) Maximal respiration of WT or Irf5−/− AMs during mitochondrial stress test, defined as the maximal oxygen consumption rate attained after addition of FCCP. (f) Spare respiratory capacity of WT or Irf5−/− AMs during mitochondrial stress test, calculated by subtraction of basal from maximal oxygen consumption rates. (g) Basal extracellular acidification rate of WT or Irf5−/− AMs. Data shown are representative of at least two individual mitochondrial stress test assays with three to four per group and are presented as mean ± standard error of the mean (s.e.m.), *P < 0·05, by Mann–Whitney U‐test.
