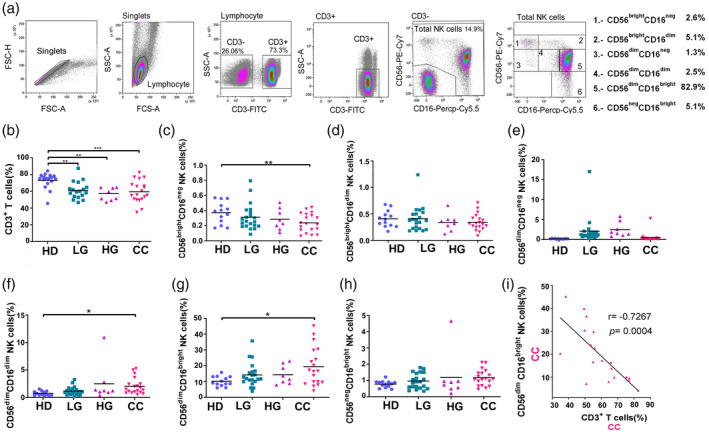
Fig. 1.

Percentages of peripheral blood natural killer (NK) and T cells in healthy donors (HD) group, low‐grade lesions (LG) group, high‐grade lesions (HG) group and cervical cancer patients (CC) group. (a) Gating strategy for the flow cytometric analysis of NK and T cells in peripheral blood mononuclear cells (PBMCs) from HD (n = 17), LG (n = 19), HG (n = 8) and CC (n = 19) groups. CD56−CD3+ cells were gated to select the region of the T cells. NK cells were subdivided into six different subsets based on the expression of CD56 and CD16. Frequency of (b) T cells, (c) CD56brightCD16neg NK cells, (d) CD56brightCD16dim NK cells, (e) CD56dimCD16neg NK cells, (f) CD56dimCD16dim NK cells, (g) CD56dimCD16bright NK cells and (h) CD56negCD16bright NK cells. (i) Correlation analysis to compare the percentage of CD56dimCD16bright NK cells veraus CD3 T cells in CC patients. Frequency data are shown as individual percentages of expression (taken from the lymphocyte gate) and their mean. Inset example of the six different groups shows percentages based on the total NK cell region. Comparisons between the groups were performed using analysis of variance (anova) with Dunnett’s multiple comparisons test. Pearson’s correlation analysis was performed to verify the linear associations between CD56dimCD16bright NK cells and the rest of the NK cell subpopulations or CD3+ T cells and the NK subpopulations. The correlation coefficient, r and P‐values are shown in the figures. *P ≤ 0·05, **P ≤ 0·01, ***P ≤ 0·001.
