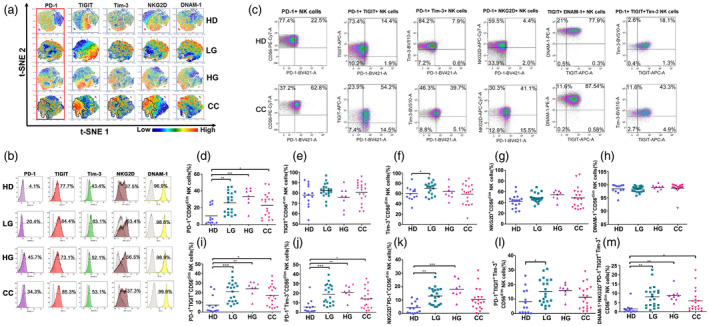
Fig. 2.

Expression and co‐expression of programmed cell death 1 (PD‐1), T cell immunoreceptor with immunoglobulin (Ig) and immunoreceptor tyrosine‐based inhibition motif (ITIM) domains (TIGIT), T cell immunoglobulin and mucin‐domain containing‐3 (Tim‐3), natural killer group 2 member D (NKG2D) and DNAX accessory molecule 1 (DNAM‐1) on peripheral blood CD56dim NK cells from healthy donors (HD) group, low‐grade lesions (LG) group, high‐grade lesions (HG) group and cervical cancer patients (CC) group. (a) t‐Distributed stochastic neighbor‐embedding analysis (t‐SNE) density plots showing expression distribution of DNAM‐1, NKG2D, TIGIT, PD‐1 and Tim‐3. The PD‐1+ region is highlighted and cross‐over with similar regions within CC is outlined. (b) Representative histogram staining for the antibodies used for each population group. (c) Representative dot‐plot analysis for all single antibody combinations and the multiple antibody combinations that showed significant differences between HD and CC. t‐SNE analysis was used to visualize expression distribution of DNAM‐1, NKG2D, TIGIT, PD‐1 and Tim‐3 in HD (n = 13), LG (n = 19), HG (n = 8) and CC (n = 19) groups. Flow cytometry gating of the data was performed to analyze the single expression of the immune checkpoints: (d) PD‐1, (e) TIGIT, (f) Tim‐3, (g) NKG2D, (h) DNAM‐1. Co‐expression of (i) PD‐1+TIGIT, (j) PD‐1+Tim‐3, (k) PD‐1+NKG2D, (l) TIGIT+DNAM and (m) PD‐1+TIGT+Tim‐3 are shown. Data are the result of analyses from HD (n = 13), LG (n = 19), HG (n = 8) and CC (n = 19) groups. Data are shown as individual percentages of expression of total CD56dim NK cells and their mean. Comparisons between the groups were performed using analysis of variance (anova) with Dunnett’s multiple comparisons test. *P ≤ 0·05, **P ≤ 0·01, ***P ≤ 0·001.
