Fig. 5.

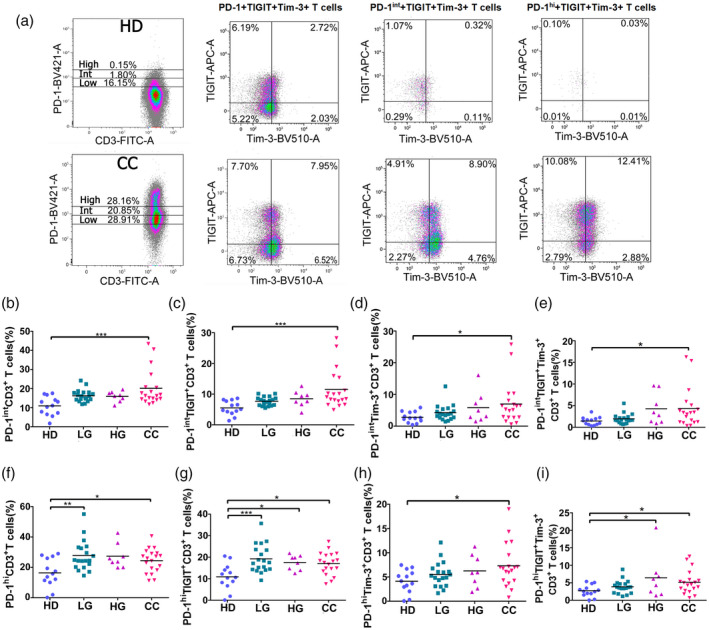
Programmed cell death 1 (PD‐1) intermediate (PD‐1int) and PD‐1 high (PD‐1high) expression on peripheral blood T cells from healthy donors (HD) group, low‐grade lesions (LG) group, high‐grade lesions (HG) group and cervical cancer patients (CC) group. PD‐1 expression was measured by flow cytometry and staining was characterized as high or intermediate depending on mean fluorescence intensity (MFI) expression. (a) Examples of high and intermediate PD‐1 expression in HD and CC; the first plot in each row shows PD‐1 divisions and the subsequent plots show T cell immunoreceptor with immunoglobulin (Ig) and immunoreceptor tyrosine‐based inhibition motif (ITIM) domains (TIGIT) and T cell immunoglobulin and mucin‐domain containing‐3 (Tim‐3) staining in PD‐1low, PD‐1int and PD‐1high subpopulations. Data are shown as individual percentages of total T cells. (b–e) In PD‐1int and (f–i) PD‐1high CD3+ T cells, the expression of TIGIT and/or Tim‐3 was evaluated for HD (n = 13), LG (n = 19), HG (n = 8) and CC (n = 19) groups. Frequency data are shown as individual percentages of expression and their mean. Comparisons between the groups were performed using analysis of variance (anova) with Dunnett’s multiple comparisons test. *P ≤ 0·05, **P ≤ 0·01, ***P ≤ 0·001.
