Fig. 6.

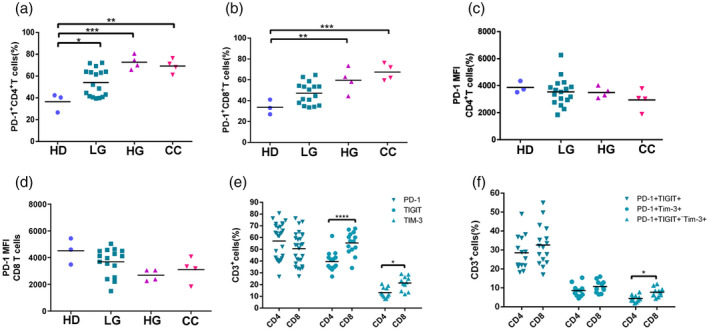
Checkpoint expression in CD4 and CD8 T cells. (a) Programmed cell death 1 (PD‐1) expression in CD4+ T cells and (b) in CD8+ T cells in healthy donors (HD) (n = 3), low‐grade (LG, n = 17), high‐grade (HG, n = 4) and cervical cancer (CC, n = 4) patients. (c) Mean fluorescence intensity (MFI) for PD‐1 expression in CD4+ T cells. (d) MFI for PD‐1 expression in CD8+ T cells. (e) Percentages of CD4 and CD8 T cells positive for PD‐1, T cell immunoreceptor with immunoglobulin (Ig) and immunoreceptor tyrosine‐based inhibition motif (ITIM) domains (TIGIT) and T cell immunoglobulin and mucin‐domain containing‐3 (Tim‐3). (f) Percentages of CD4 and CD8 T cells positive for PD‐1+TIGIT+, PD‐1+Tim3+ and PD‐1+TIGIT+Tim3+. P ≤ 0·05, **P ≤ 0·01, ***P ≤ 0·001.
