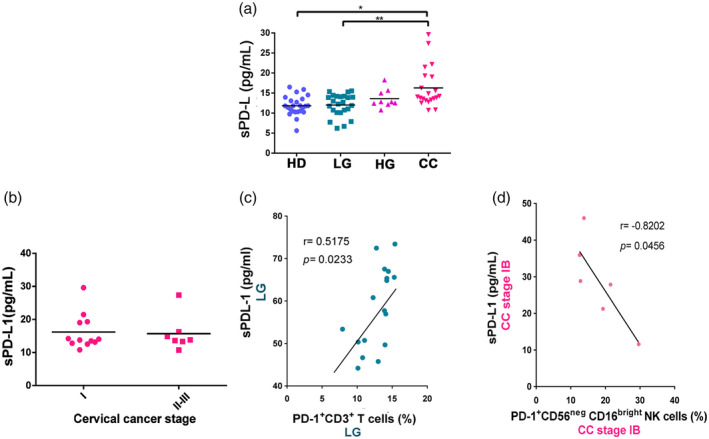
Fig. 7.

Soluble programmed cell death ligand 1 (sPD‐L1) in serum from healthy donors (HD) group, low‐grade lesions (LG) group, high‐grade lesions (HG) group and cervical cancer patients (CC) group. (a) The concentration of soluble PD‐L1 in the serum of HD (n = 24), LG (n = 24), HG (n = 9) and CC (n = 21) was measured by enzyme‐linked immunosorbent assay (ELISA). Data are shown as pg/ml of sPD‐L1 and their mean. (b) sPD‐L1 in the serum of cervical cancer patients classified according to clinical stage. (c) A correlation analysis was performed between sPD‐L1 and the percentages of PD‐1+CD3+T cells in the LG group. (d) A correlation analysis was performed between sPD‐L1 in cervical cancer patients stage IB and their respective percentages of PD‐1+CD56negCD16bright NK cells. Comparison between the groups were performed using analysis of variance (anova) with Dunnett’s multiple comparisons test. Pearson’s correlation analysis was performed to verify the linear associations between sPD‐L1 and the percentages of PD‐1+NK cells and PD‐1+CD3+ T cells. The correlation coefficient, r and P‐values are shown in the figures. *P ≤ 0·05, **P ≤ 0·01, ***P ≤ 0·001.
