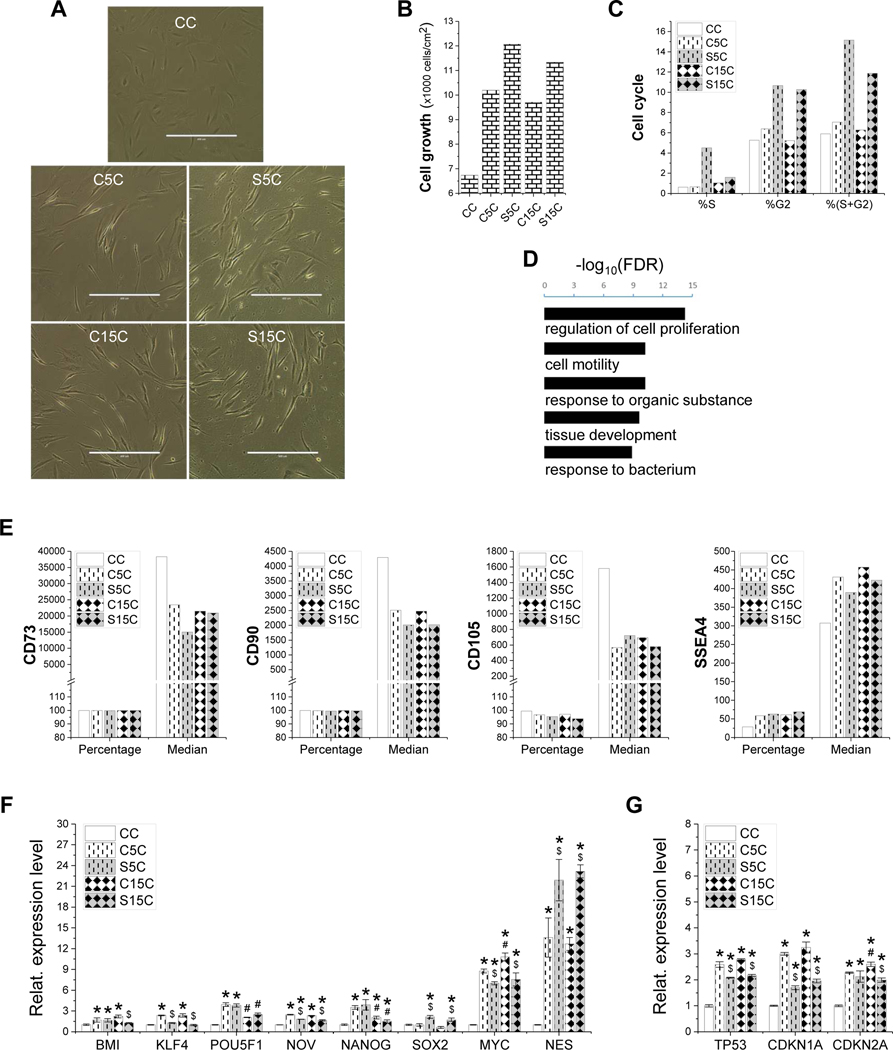
Figure 4.
Evaluation of high-passage IPFSCs’ proliferation after growth on dECMs and TCP. Cell morphology of passage 15 IPFSCs (A) was photographed on TCP (CC) and dECMs deposited by passage 5 IPFSCs (C5C), passage 15 IPFSCs (C15C), SV40LT transduced passage 5 IPFSCs (S5C) and SV40LT transduced passage 15 IPFSCs (S15C). Scale bar: 400 μm. Cell proliferation was evaluated using cell counting for cell growth (B), flow cytometry for cell cycle (C) and RNASeq analysis (D), in which Gene Ontology enrichment analysis on biological processes was done for genes upregulated in the dECM expanded IPFSCs (C5C, C15C, S5C and S15C) as compared to those cultured on TCP (CC) (t-test p-value<0.01 and fold change>2) (D). Surface markers were evaluated using flow cytometry including CD73, CD90, CD105 and SSEA4 (E). TaqMan® real-time quantitative PCR was used to evaluate stemness genes (BMI1, KLF4, POU5F1, NOV, NANOG, SOX2, MYC and NES) (F) and senescence genes (TP53, CDKN1A and CDKN2A) (G). GAPDH served as an internal control. Data are exhibited as bar charts. Statistically significant differences are indicated using * when compared to CC, using $ when compared to corresponding C5C or C15C and using # when compared to corresponding C5C or S5C (p<0.05).

