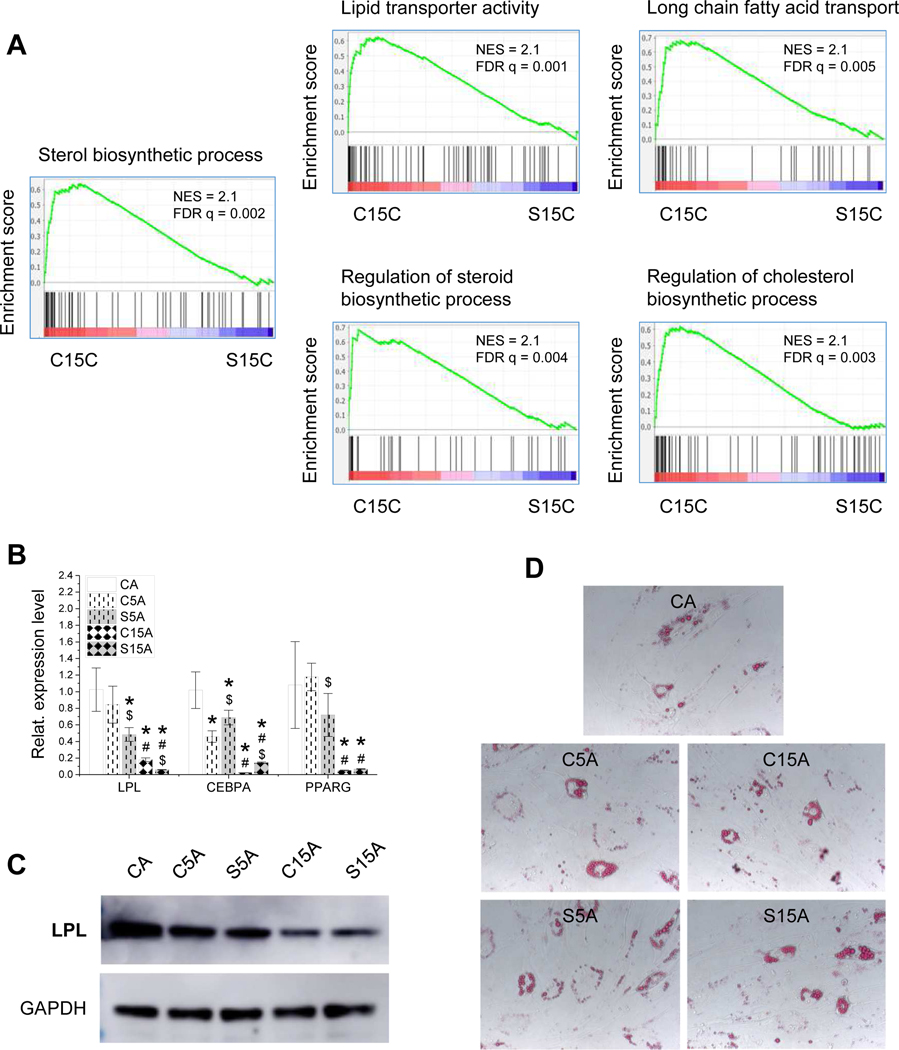
Figure 7.
Adipogenic evaluation of high-passage IPFSCs after growth on dECMs and TCP. GSEA for expressed genes ranked by the fold change of expression (C15C/S15C) against MSigDB gene sets related to adipogenesis (A). Following expansion on TCP (CC) and dECMs deposited by passage 5 IPFSCs (C5C), passage 15 IPFSCs (C15C), SV40LT transduced passage 5 IPFSCs (S5C) and SV40LT transduced passage 15 IPFSCs (S15C), passage 15 IPFSCs were incubated in adipogenic induction medium for 21 days. To confirm adipogenic capacity of IPFSCs, TaqMan® real-time quantitative PCR was used to assess expression of adipogenic marker genes (LPL, CEBPA and PPARG) (B), western blot was used to evaluate LPL expression at a protein level (C), and Oil Red O (ORO) was used to stain lipid droplets (D). Gene expression data are exhibited as bar charts. Statistically significant differences are indicated using * when compared to CC, using $ when compared to corresponding C5C or C15C and using # when compared to corresponding C5C or S5C (p<0.05).

