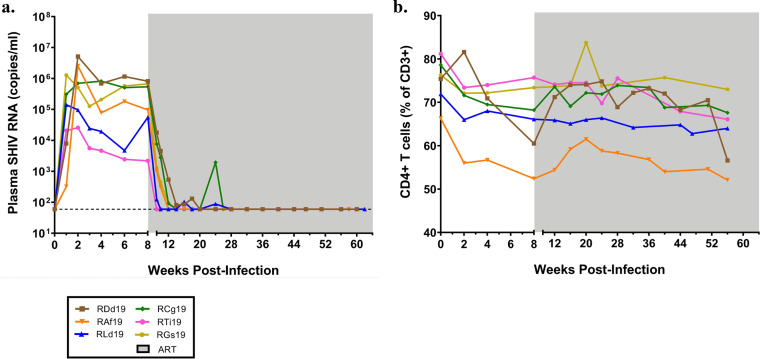
FIG 2.
Viral loads and CD4+ T cell frequencies in macaques on long-term ART. (a) Plasma viral loads measured longitudinally by real-time RT-PCR. The dashed line indicates the LOD. (b) Peripheral CD4+ T cell frequency determined by flow cytometry staining of whole blood. Each curve represents one animal, and the shaded region indicates the weeks that the animals were on ART (n = 6).

