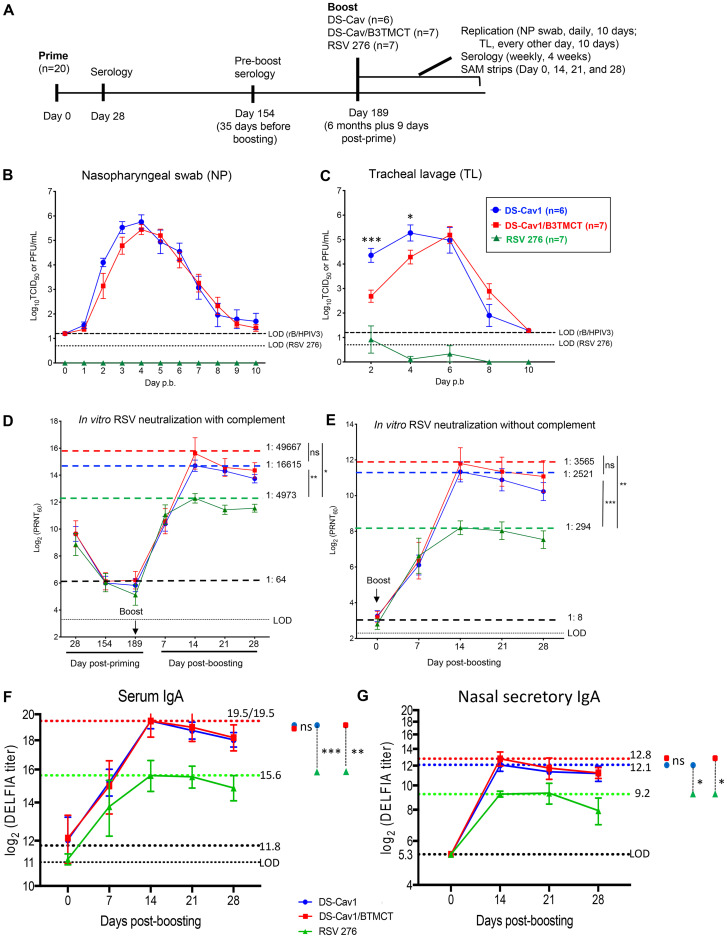
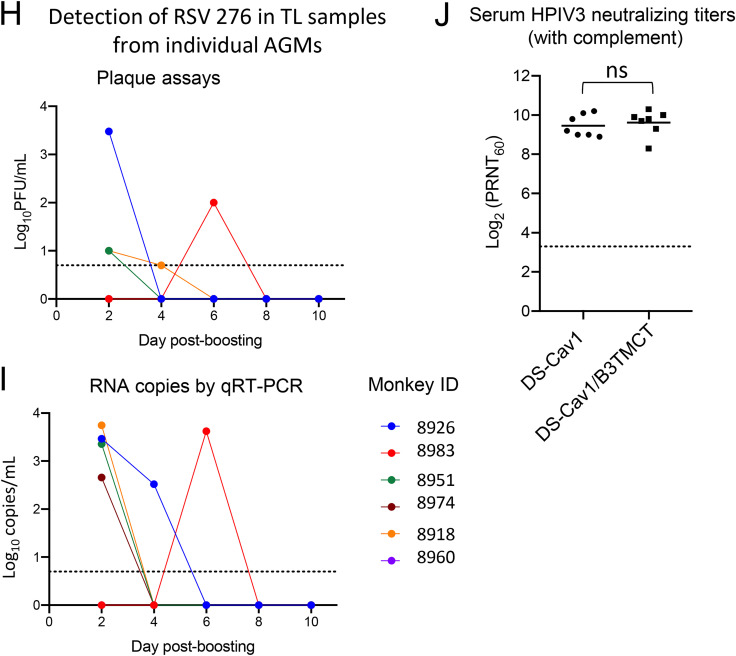
FIG 3.
AGM experiment 2: viral replication and serum RSV-PRNTs in AGMs when the interval between priming and boosting was ∼6 months (6 months plus 9 days). (A) Study design. Twenty AGMs were previously administered a primary infection with one of five attenuated RSVs (Table 2) by the combined i.n. and i.t. routes. Sera were collected on days 28 and 154 (the latter being 35 days before boosting), and RSV-PRNTs were measured in the presence of complement. The AGMs were organized into three groups (n = 6, 7, and 7) that were balanced with regard to day 154 serum RSV-PRNTs, the identity of the priming virus, and the sex ratio (Table 2). On day 189 (6 months plus 9 days) postpriming, the groups were boosted with one of three viruses, i.e., (i) RSV 276 (n = 6), (ii) DS-Cav1 vector (n = 7), or (iii) DS-Cav1/B3TMCT vector (n = 7). Viral shedding and serum RSV-PRNTs were monitored as described in the legend to Fig. 2. Nasal mucosal lining fluid was collected for IgA analysis using SAM strips on days 0, 14, 21, and 28 post-boosting (see Materials and Methods for details). (B and C) Viral titers in the NP (B) and TL (C) samples shown as means, with brackets indicating SEMs, and LODs shown as dashed lines (vectors) and dotted lines (RSV). (D) Serum RSV-PRNTs at 28, 154, and 189 days postpriming, and 7, 14, 21, and 28 days post-boosting, assayed with complement. (E) RSV-PRNTs at 0, 7, 14, 21, and 28 days post-boosting, assayed without complement, shown as means, with brackets indicating SEMs. Panels D and E are annotated to show the mean serum RSV-PRNT for the combined three groups at the time of boost (black dashed lines, with mean arithmetic values given); in addition, dashed colored lines indicate the highest mean RSV-PRNT for each group, with arithmetic values given. (F and G) Serum and nasal mucosal IgA responses in AGMs. IgA antibody titers were measured in serum samples (F) collected on days 0, 7, 14, 21, and 28 post-boosting and nasal mucosal lining fluid samples (G) collected on days 0, 14, 21, and 28 post-boosting (note that one of the day 28 SAM specimens in the DS-Cav1/BTMCT group did not provide sufficient volume; therefore, the day 28 mean titer for the DS-Cav1/BTMCT vector was calculated for 6 animals only). IgA titers were measured by binding to purified RSV DS-Cav1 F protein in a DELFIA TRF assay. The antibody titers are given as the log2 dilution of serum or mucosal specimen yielding 400 fluorescence units, shown as means, with brackets indicating SEMs. Mean antibody titers for the combined three groups at the time of boost (day 0) are indicated by the larger black dotted lines; the titers of all SAM samples on day 0 were below the LOD (5.3 log2 units. The LODs are indicated by the smaller black dotted line. The dashed colored lines indicate the highest mean antibody titer for each group. Peak mean titers of three groups were compared pairwise by Student's t test (GraphPad Prism). *, 0.01 < P < 0.05; **, 0.001 < P < 0.01; ***, 0.0001 < P < 0.001; ns, not significant (P > 0.05). (H and I) Replication of RSV 276 in the TL samples from AGMs primed with attenuated RSV ∼6 months earlier. The titers of RSV 276 in TL samples on days 2, 4, 6, 8, and 10 postboosting were quantified by immunoplaque assay (H) and RT-qPCR assays (I) specific for both positive- and negative-sense RSV M gene sequences. Each color represents an individual monkey. The LOD is indicated with a dotted line. (J) Serum HPIV3-PRNTs induced by DS-Cav1 and DS-Cav1/B3TMCT vectors in AGMs primed with live-attenuated RSV 6 months earlier. Sera collected 2 weeks after boosting with DS-Cav1 and DS-Cav1/B3TMCT vectors were analyzed by the 60% PRNT assay for HPIV3 with complement. The dots indicate individual animals; group means are indicated with short horizontal lines. The dotted line indicates the LOD. Mean serum HPIV3-PRNTs of two groups were compared by Student's t test. ns, not significant (P > 0.05).


