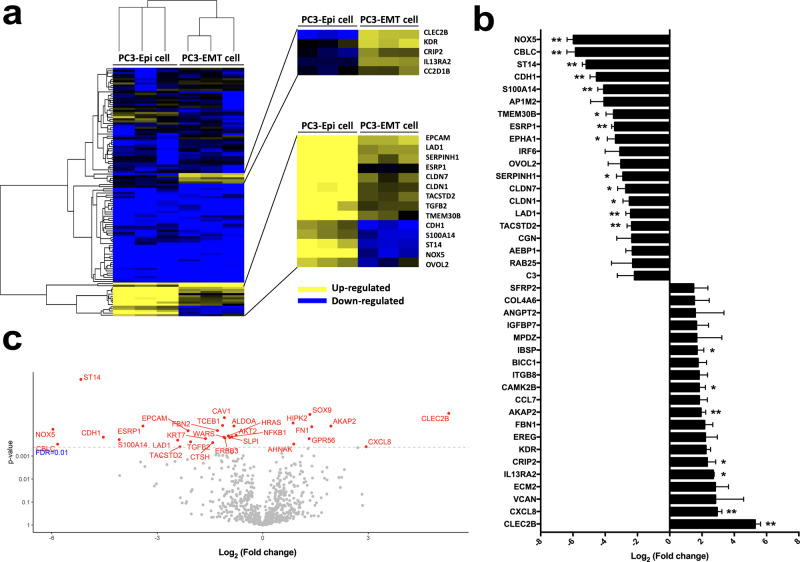
Figure 3.
Comparison of the mRNA expression levels in PC3-Epi cells and PC3-EMT cells. (a) Heatmap demonstrating the unique gene expression patterns between PC3-Epi cells and PC3-EMT cells. Upregulated genes are in yellow, and downregulated in blue. (b) Top 20 differentially expressed genes in PC3-EMT cells versus PC3-Epi cells. Data are reported as the log2 of the fold change relative to PC3-Epi cells. Bars represent mean ± SEM. *p < 0.05, **p < 0.01. (c) Volcano plot demonstrating significances versus means of differential fold changes for the comparison of PC3-Epi cells and PC3-EMT cells. Data are reported as x-axis = log2 (fold change of PC3-EMT cells/PC3-Epi cells), y-axis = p value. The horizontal dashed line indicates a false discovery rate (FDR) q value of 0.01.

