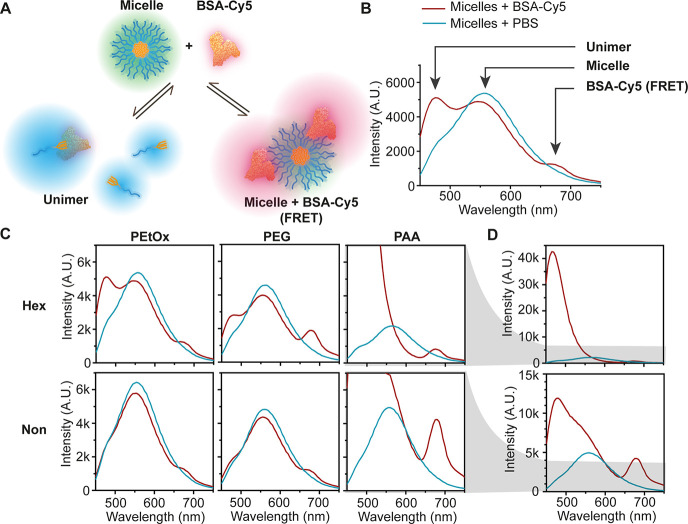
Figure 4.
(A) Illustration of the two main possible interaction pathways with Cy5-labeled BSA: interaction of BSA either with unimer (left) or micelle (right). (B) Selected fluorescence emission spectrum with arrows highlighting the contribution of the different species to the spectrum. (C) Fluorescence spectra of the micelles with (red lines) and without (blue lines) BSA-Cy5 and (D) zoom out into PAA amphiphiles emission spectra. [amphiphile] = 160 μM, [BSA-Cy5] = 5.5 mg/mL, λEx = 420 nm.

