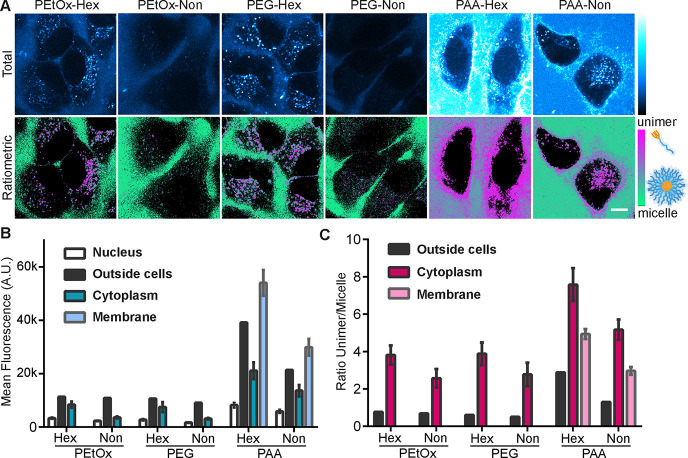
Figure 5.
Internalization of micelles into HeLa cells after 1 h of incubation in DMEM with 10% FBS. Images show total fluorescence signal with 405 nm excitation (A, top row) or ratiometric images of unimer/micelle pixel ratio after background removal (A, bottom row). The green color indicates the micellar form, and magenta indicates the unimer form. The scale bar is 10 μm. The median fluorescence for control areas (inside nucleus as a negative control and in solution outside cells as a positive control) were plotted along with the mean fluorescence inside the cytoplasm or in the membrane area (n = 8–10 cells) for either total fluorescence (B) or unimer/micelle ratio (C).

