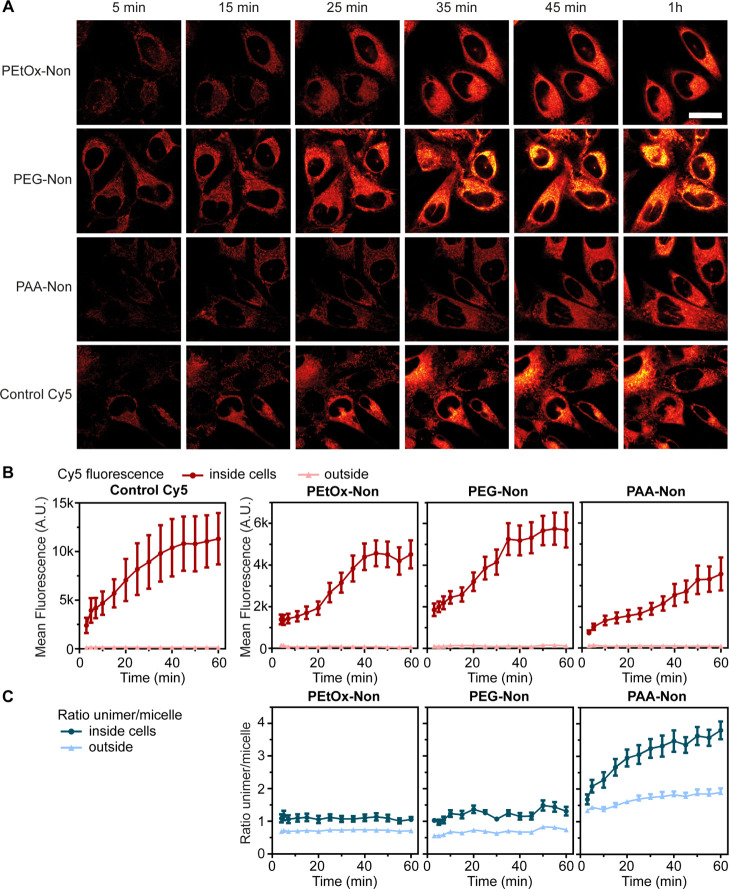
Figure 7.
Release of encapsulated Cy5 onto HeLa cells over time. (A) Fluorescence with 640 nm excitation is shown inside HeLa cells at different time points for hydrophobic Cy5 encapsulated in micelles or free, in full DMEM (10% FBS), scale bar is 20 μm. The quantification of fluorescence from confocal images with (B) as mean fluorescence intensity in the Cy5 channel, with 640 nm excitation or (C) 405 nm excitation is shown as ratio of unimer/micelle signal. Regions of interest were manually drawn around cell cytoplasm, including the cell membrane and excluding the nucleus; n = 10 cells. [amphiphile] = 160 μM, [Cy5] = 4 μM.

