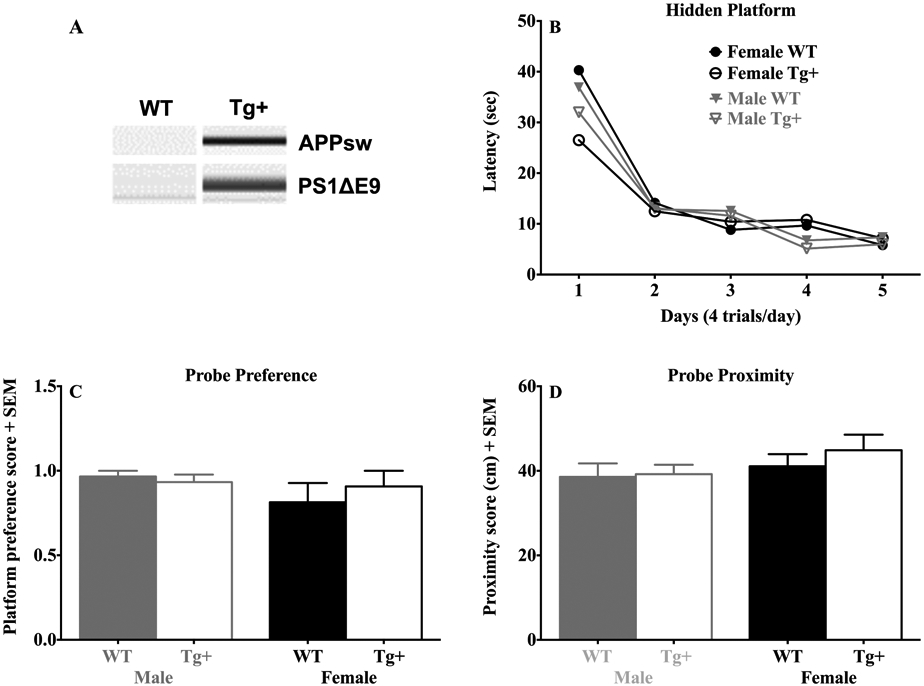
Figure 1.

Effects of sex and genotype in the hidden platform navigation and probe test. (A) qPCR results from APPsw and PS1ΔE9 reactions. (B) Latency (seconds) to find the platform during the 5-day training period. (C) The platform quadrant preference during the 30 second probe test. (D) Swim proximity (cm) to the platform location during the probe test. Data are expressed as mean + SEM. Note that Tg+ and WT rats exhibited similar performance on hidden platform training and probe testing.
