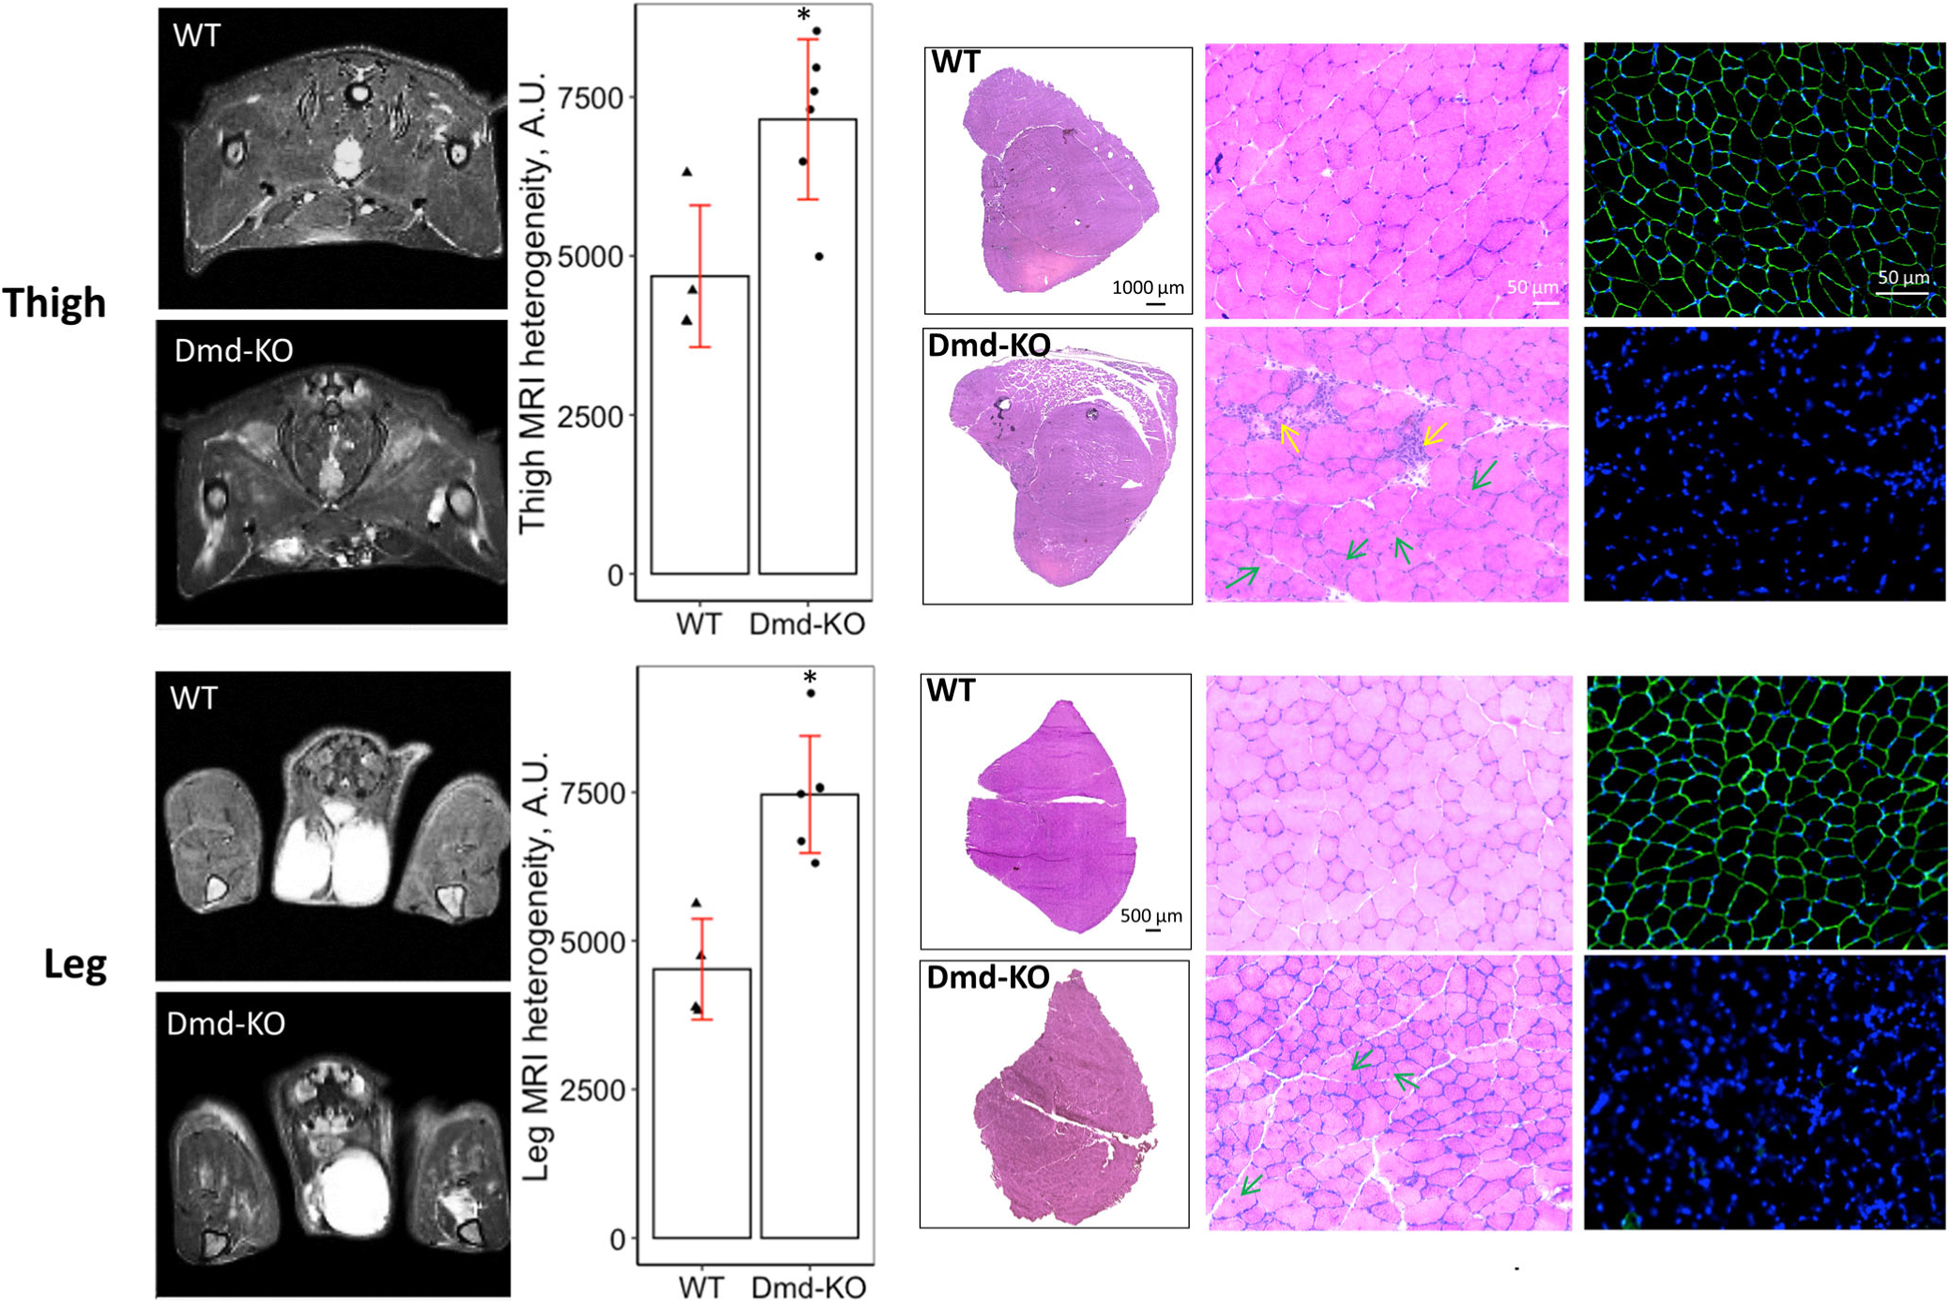
FIGURE 1.

T2-weighted images show the thigh and leg muscles in cross-sections (axial, transverse plane) in WT and Dmd-KO rats. As noted in the Methods, imaging was performed prior to any contractile testing. Dmd-KO rat muscles have increased T2 signal, heterogeneity, and localized hyperintensities, which have been linked to muscle damage, inflammation, and fatty infiltration. Bar graphs show heterogeneity quantification of the MRI. H&E micrographs on the left show stitched images of the entire muscle for quadriceps and TA (muscle shown are from the untested side to eliminate effects of contractile testing/injury). H&E micrographs on the right show higher power representative images of muscle tissue in cross section. WT muscles show congruent muscle fibers with relatively similar size, while Dmd-KO muscle show variability in fiber size, inflammation (yellow arrows), and centrally nucleated fibers (green arrows), a marker of ongoing muscle degeneration/regeneration. The immunofluorescent micrographs show labeling for dystrophin (green) and nuclei (blue), with absence of dystrophin in Dmd-KO muscles. A.U. = arbitrary units; * = significance at P < .05
