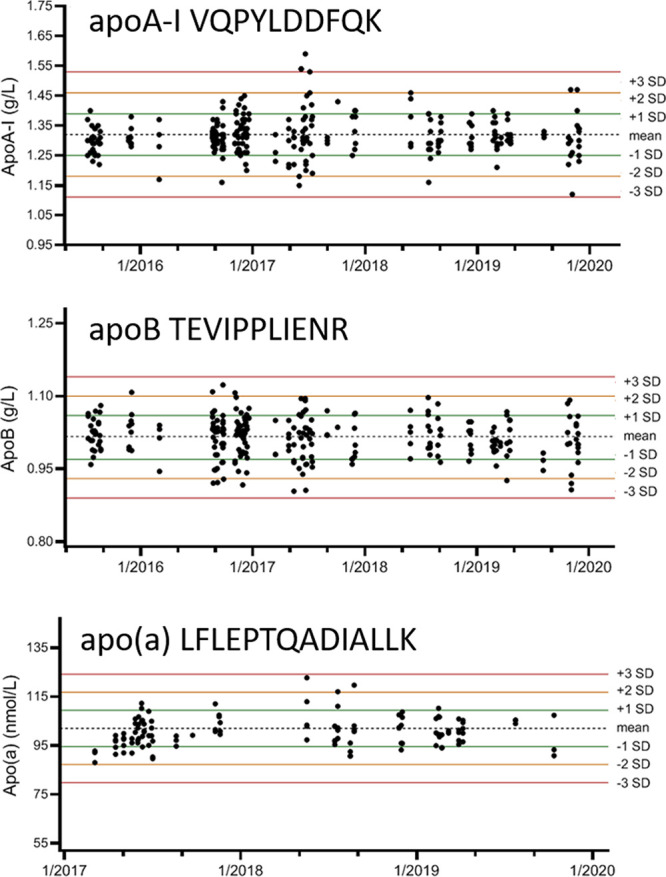
Figure 4.

Levey–Jennings plots with concentrations of apolipoproteins A-I, B and (a) based on peptides VQPYLDDFQK, TEVIPPLIENR, and LFLEPTQADIALLK, respectively. Results from apoA-I and apoB were obtained from a single QC sample (n = 237) measured in 77 runs over four years (top and middle plot). Results from apo(a) were obtained from a second QC sample measured in 33 runs (n = 71) over three years (bottom plot). Recent measurements (2019-present) on a second Agilent 6495 QQQ-MS system in our laboratory have demonstrated similar long-term performance (data not shown).
