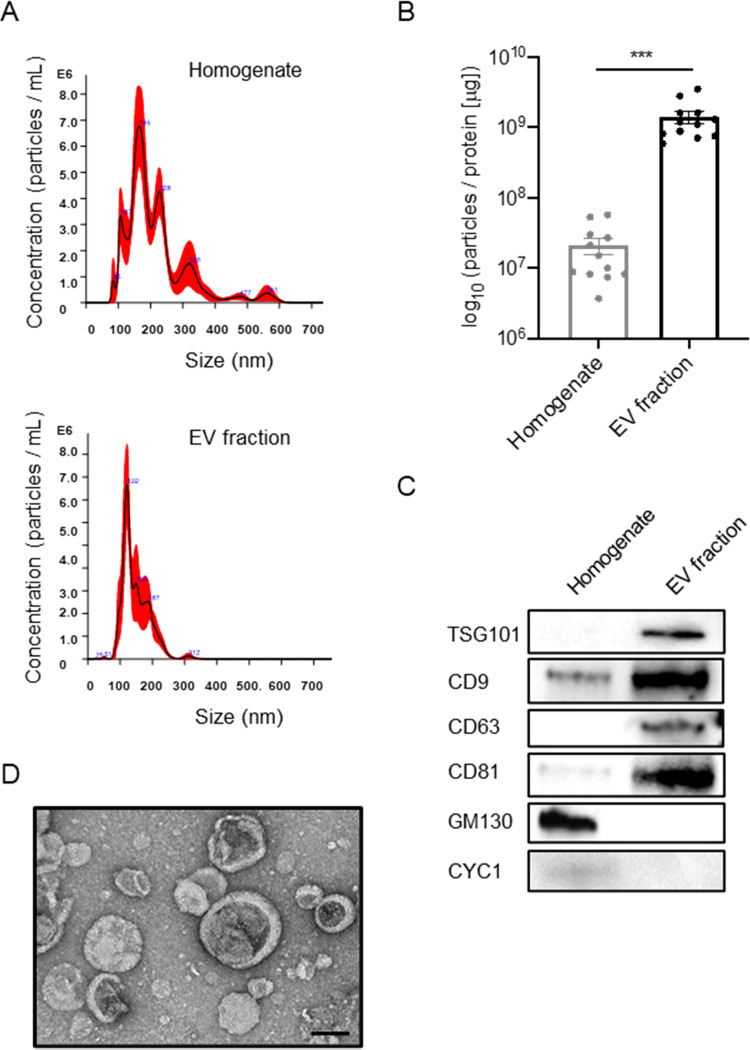
Figure 1.
Biochemical characteristic of brain-derived EVs separated from frozen mouse brain tissue. (A) NTA plot of average size and concentration of particles from brain homogenates and separated EV fraction. The black line shows the fitting curve. The red line represents the error bar. The y axis is the concentration of particles. The x axis is the size of particles. Top: brain homogenates, bottom: separated EV fraction. (B) Ratio of particles to protein concentration to quantify particle purity (p = 0.005 by a paired sample Wilcoxon test). (C) Assessment of EV and non-EV marker proteins, including TSG101, CD9, CD63, CD81, GM130 (Golgi marker), and CYC1 (Mitochondrial marker), in the separated EV fraction. (D) Transmission electron microscopy (TEM) image of mouse brain-derived EV fraction. Scale bar: 100 nm.

