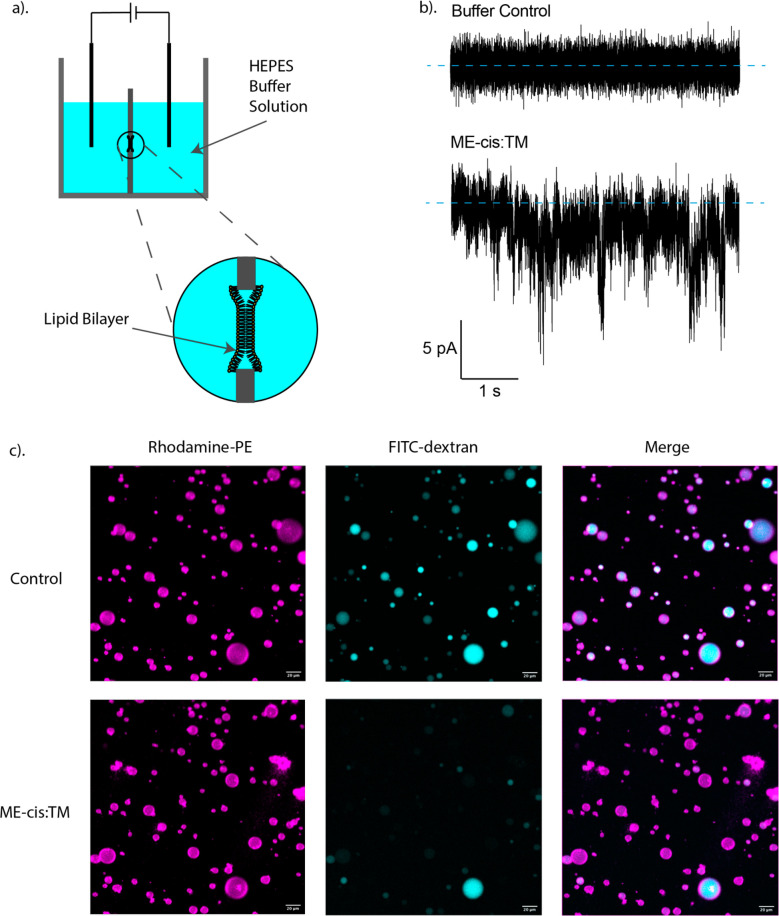
Figure 5.
(a) Setup of black lipid membrane (BLM) experiments. (b) BLM results with HEPES buffer control (upper graph) and ME-cis:TM (lower graph), with 2 μL of 250 μg/mL ME-cis:TM in PBS added to one side of the BLM chamber. (c) Giant unilamellar vesicles (GUVs) formed from 9:1 DOPC:DOPS encapsulating 4 kDa FITC-labeled dextran, before (control panel) and after (ME-cis:TM panel) the addition of 20 μL of a 1 mg/mL ME-cis:TM solution to 100 μL of GUV suspension. Cyan color came from FITC-labeled dextran, and magenta color came from rhodamine-labeled GUV membranes. The disappearance of cyan color from GUVs in the FITC-channel of panel c indicates leakage of FITC-labeled dextran.

