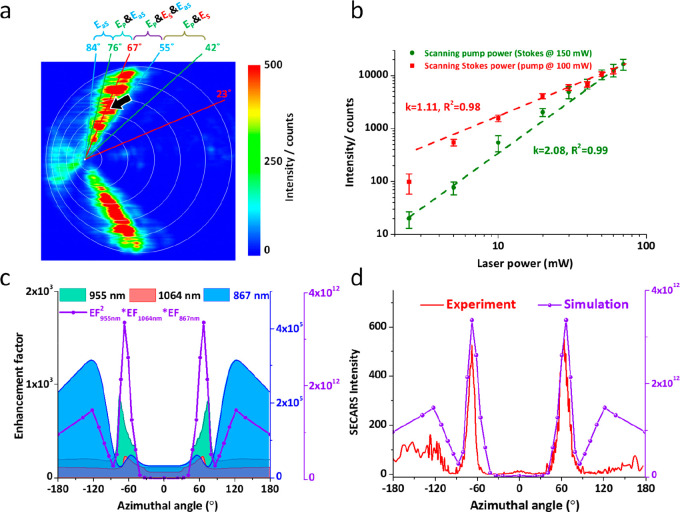
Figure 4.
(a) Experimental SECARS intensity map recorded at the anti-Stokes wavelength (867 nm), i.e., 1070 cm–1 blue-shifted from the pump at 955 nm. (b) Power dependence of SECARS intensity on the pump (green) and Stokes (red). Laser focal spot is positioned at the location marked with the black arrow in (a). (c) Simulated enhancement factor at the pump (green, scale to the left) and Stokes frequencies (red, scale to the left), as well as the enhancement factor in the scattering at the anti-Stokes frequency (light blue, scale to the right). Overall enhancement calculated using ISECARS ∝ Ep4·ES2·EaS2 is also plotted with a separate scale on the right side. (d) Experimental SECARS intensity (red, scale to the left) and simulated SECARS enhancement factor (violet, scale to the right) as functions of the azimuthal angle.

