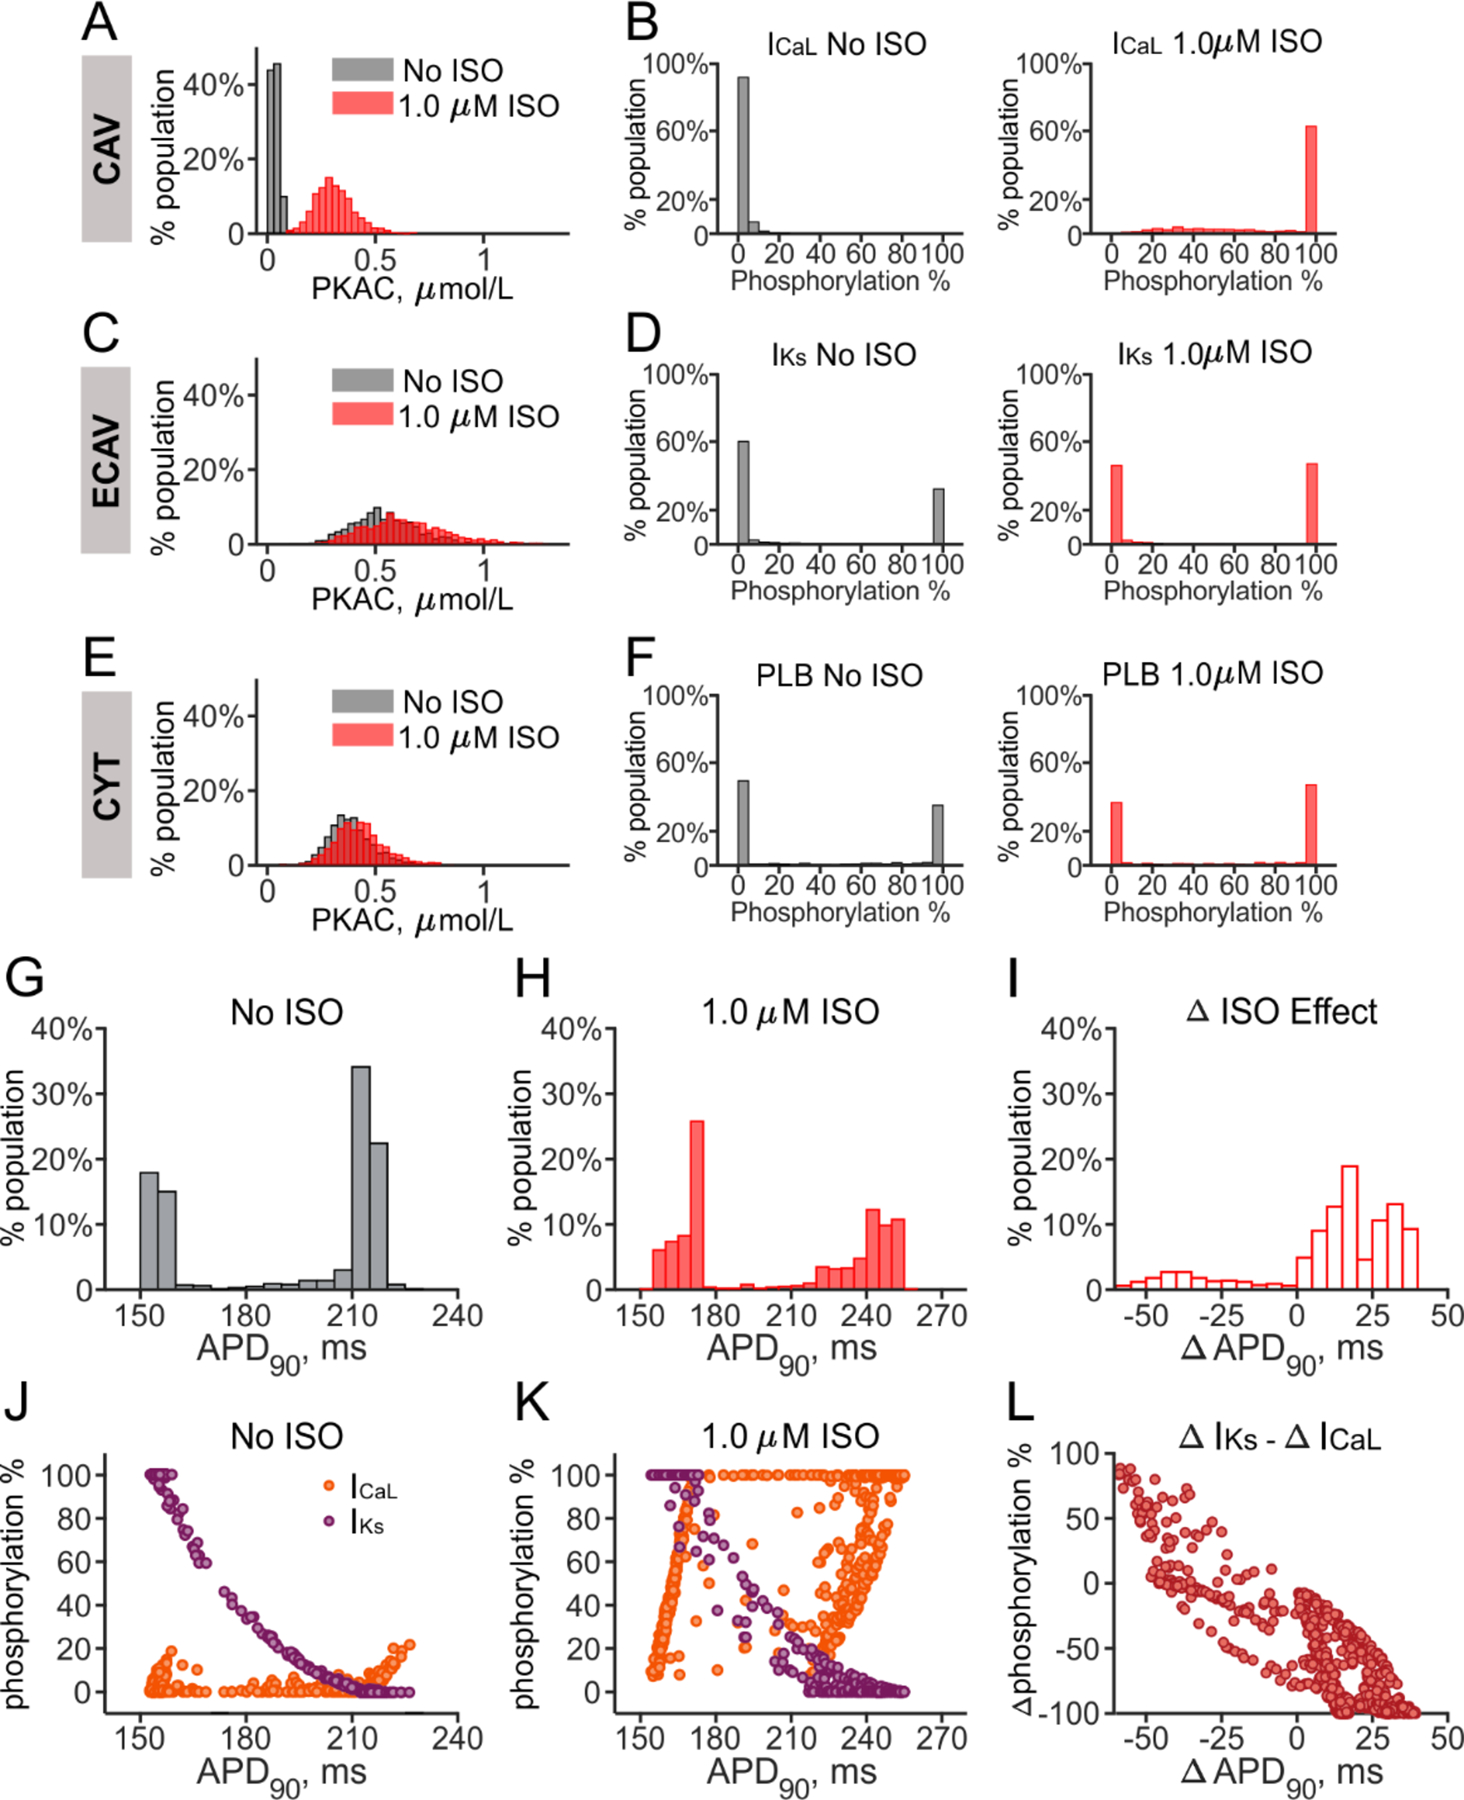
Figure 4. Compartment-dependent differential phosphorylation in the signaling population.

(A, C, E) Distributions of PKA catalytic subunit (PKAC) in the CAV, ECAV, and CYT compartments are plotted from the signaling population of 1000 myocytes. (B, D, F) Phosphorylation fractions for ICaL (B), IKs (D) and PLB (F) are shown, as representative PKA targets in the CAV, ECAV, and CYT domains respectively. The percentage of cells in each bin is shown, before (gray) and after (red) β-AR stimulation. (G, H) Distributions of APD90 from the signaling population, in the absence (G) and presence (H) of 1 μM ISO, are replotted from Figure 3E for comparison. (I) Distribution of change in APD90 with ISO, (Δ ISO effect) is plotted for all cells in the signaling population. (J, K) Phosphorylation fraction of ICaL (orange) and IKs (purple) for each cell in the signaling population is plotted as a function of the corresponding value of APD90, before (J) and after (K) application of 1.0 μM ISO. (L) The difference between Δ ISO effect on IKs and ICaL phosphorylation fractions for each cell in the population is plotted versus the corresponding Δ APD90 value.
