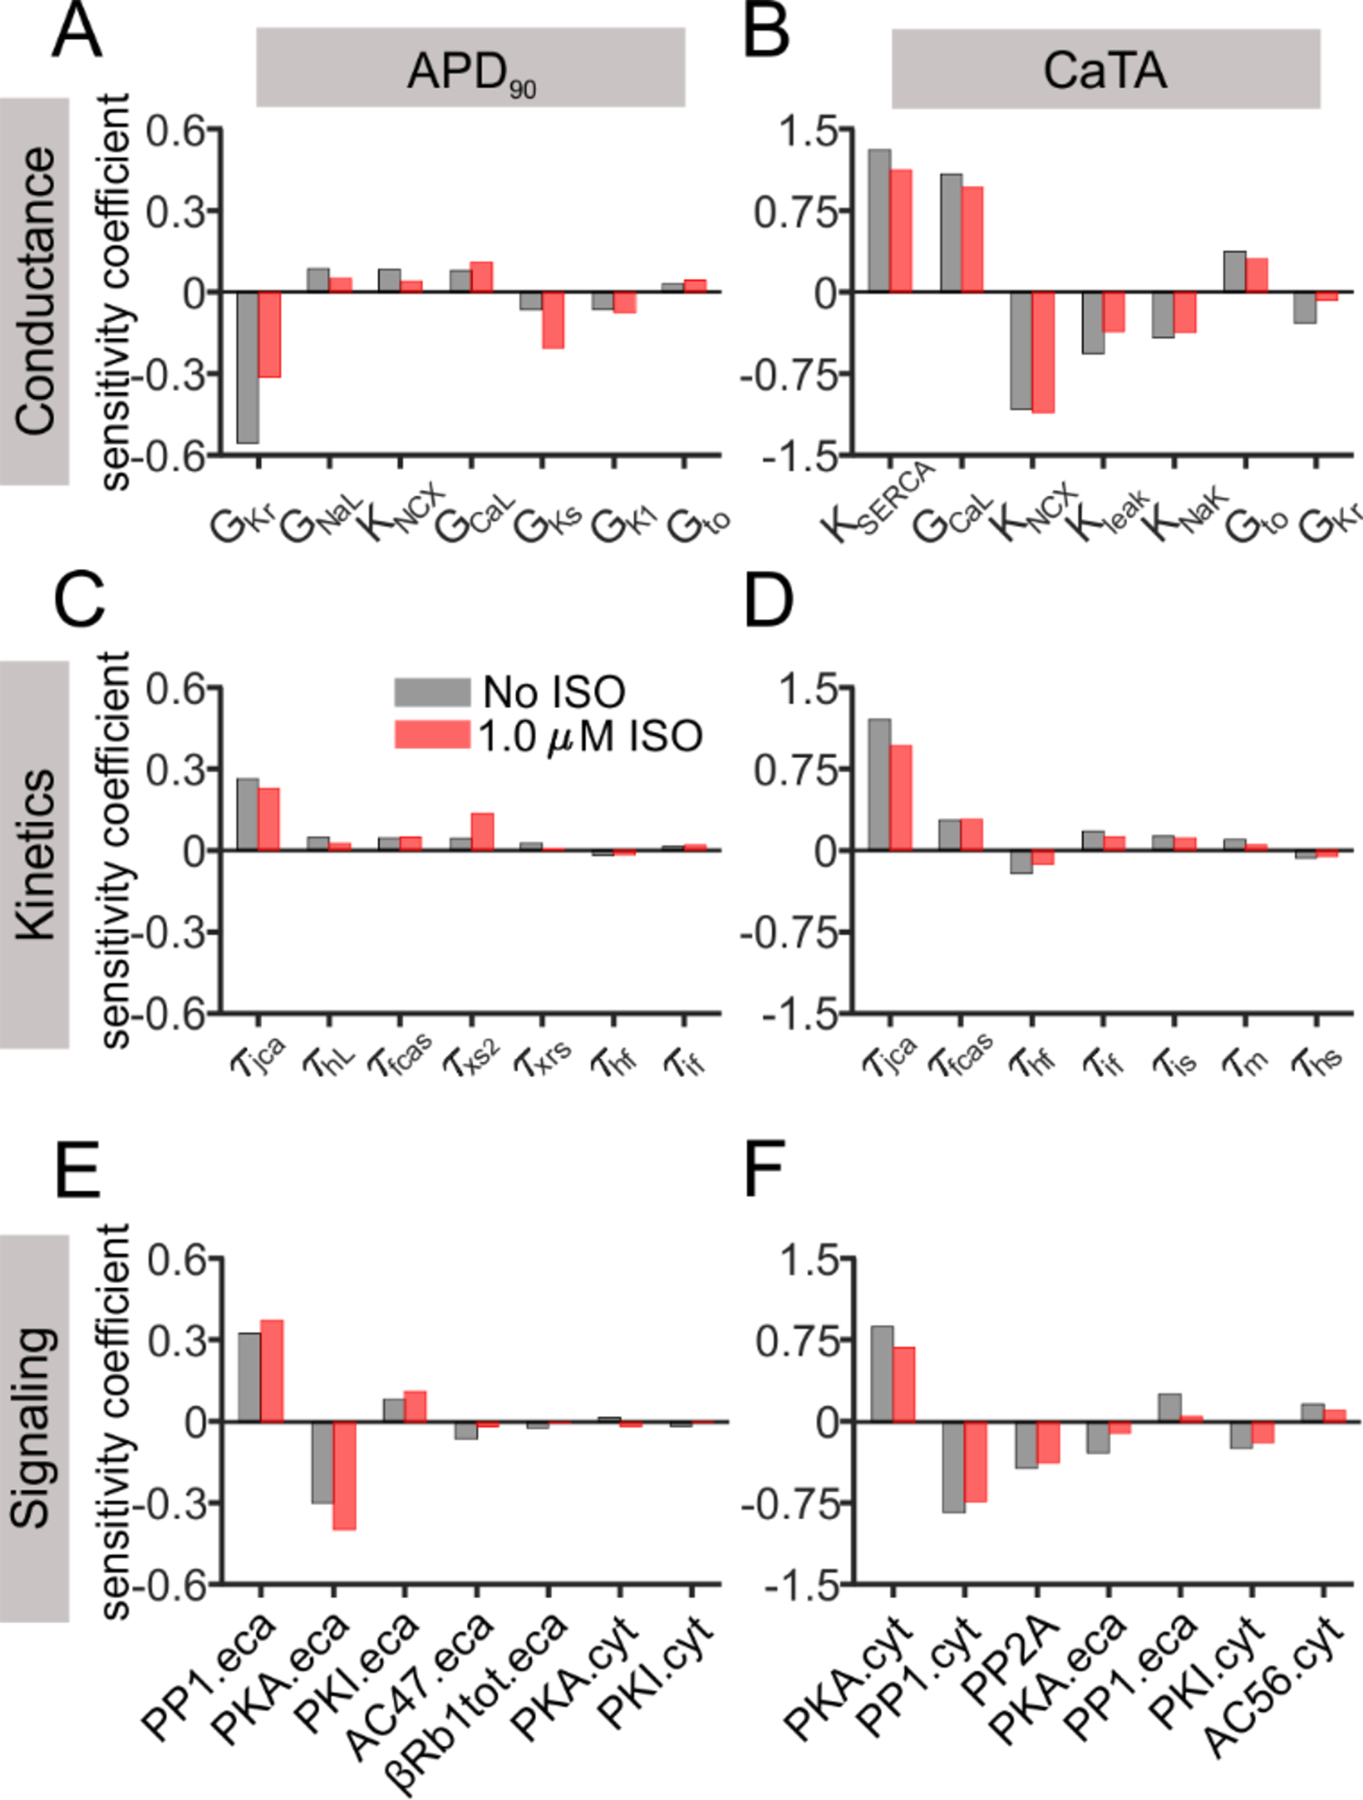
Figure 5. Most important determinants of APD90 and CaTA in the conductance, kinetics, and signaling populations.

(A, B) Sensitivity coefficients of the most important parameters affecting APD90 and CaTA are shown for the conductance population. (C, D) Sensitivity coefficients of the most important parameters are shown for the kinetics population. (E, F) Sensitivity coefficients of the most important parameters are shown for the signaling population. Parameters in each population are arranged in descending order based on their contribution at baseline (gray bars), in comparison to the corresponding values under 1.0 μM ISO (red bars).
