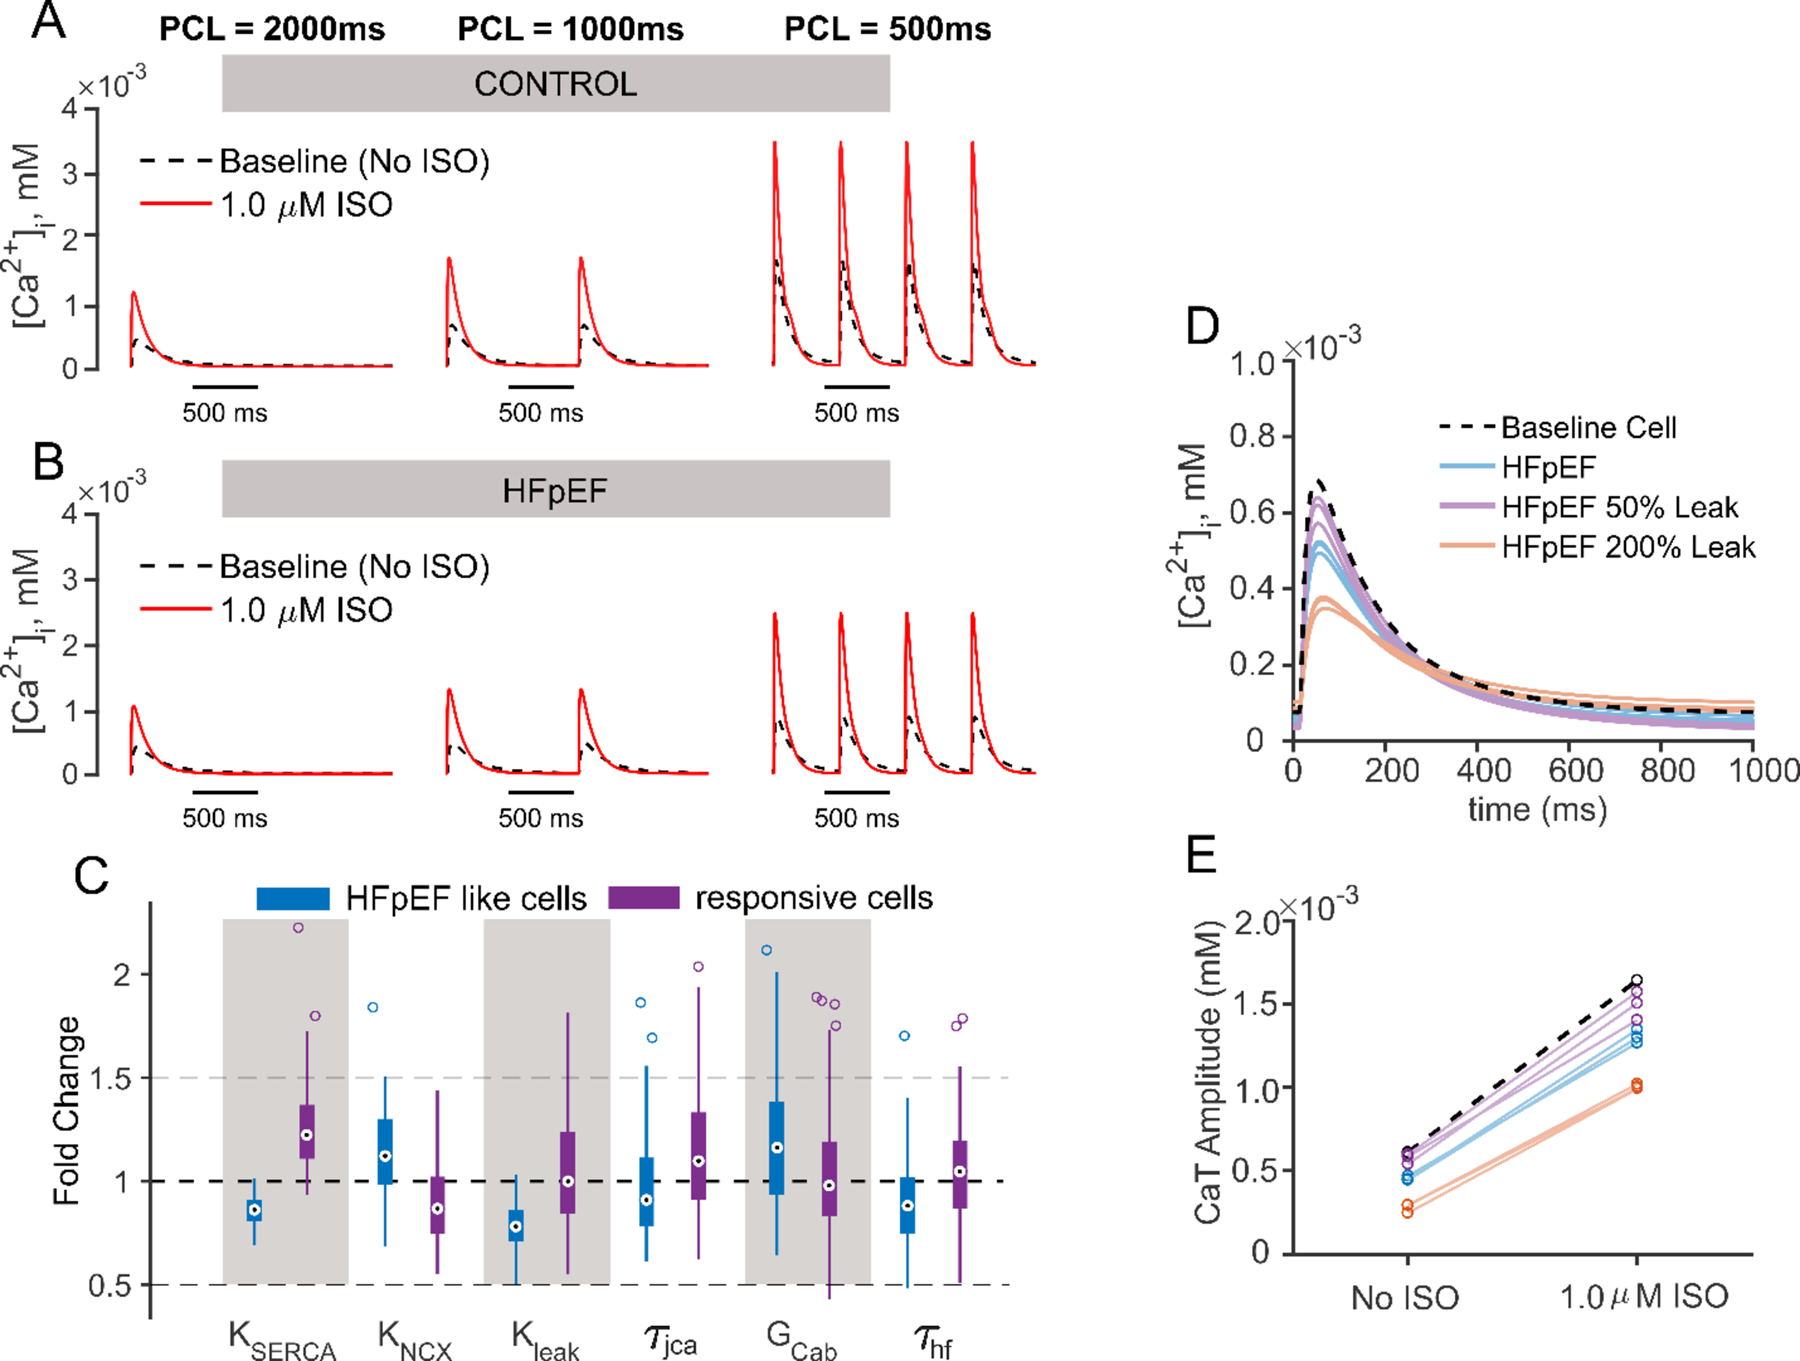
Figure 6. HFpEF phenotypic selection and relevant parameters contributing to the phenotype.

(A, B) Ca2+ transient waveforms of model baseline cell (CONTROL, A) and representative HFpEF-like cell (HFpEF, B), under three pacing cycle length 500 ms, 1000 ms and 2000 ms are shown. In both panels results with no ISO are shown in black dashed lines, and results with 1.0 μM ISO are shown in red solid lines. (C) Box plot is shown to contrast the five most differentially distributed parameters between the HFpEF (blue) and the responsive (purple) cells. (D) CaTs simulated at 1 Hz in 3 HFpEF cells with parameters as identified in the selection process (blue), with leak further reduced by 50% (purple), and with leak increased by 200% (orange). An increase in SR Ca2+ leak in these cells reduces baseline CaTA, converting these myocytes into more of a HFrEF-like phenotype. (E) Changes in CaTA in the cells shown in (D) caused by isoproterenol suggest that leak by itself does not affect the β-AR response.
