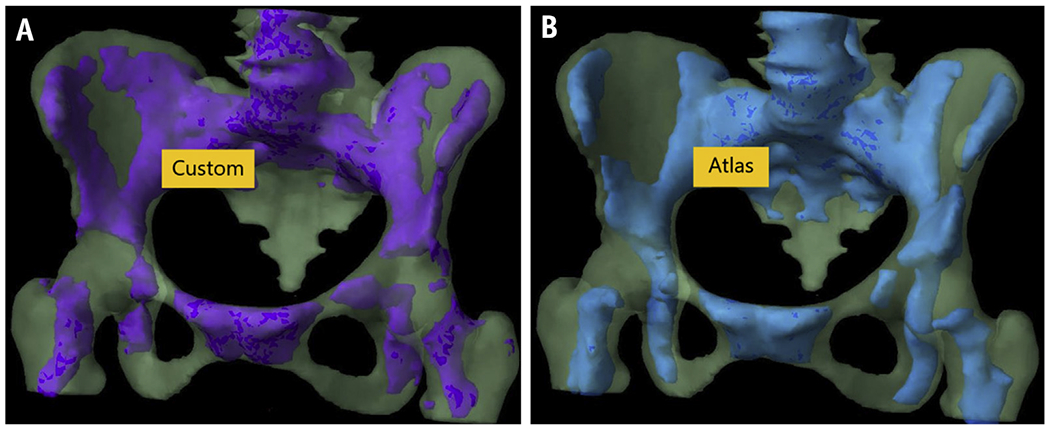
Fig. 2.

Canonical distribution of metabolically “active” bone marrow subregions in a patient with cervical cancer, with “active” marrow defined either by custom (A) positron emission tomography–based segmentation or (B) multiatlas-based segmentation.
