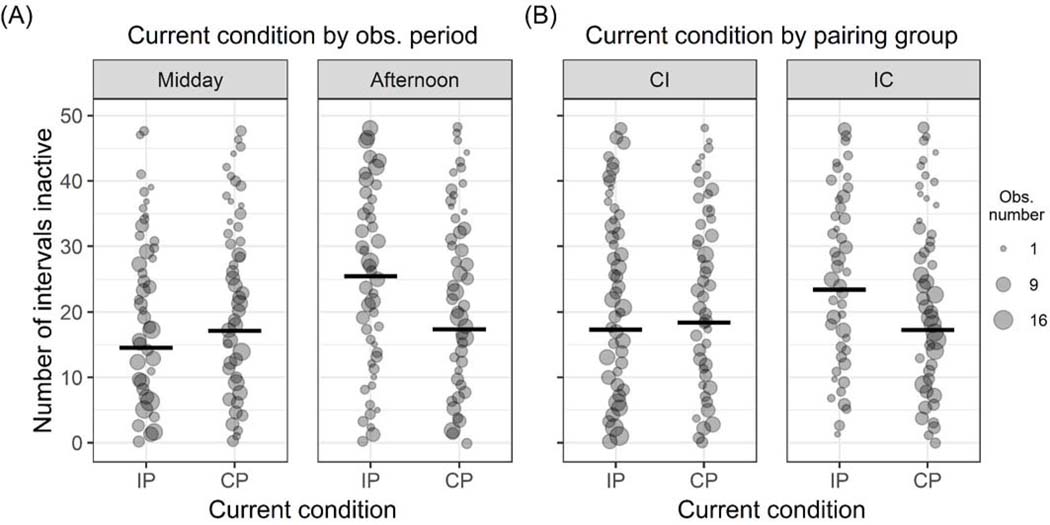
Figure 2:
Effects of the interactions within the final inactivity model. Point size scales with number of observations. Thick horizontal lines indicate the fitted model estimates for each condition when all other predictors and number of observation intervals are at their mean. (A) Interaction between the current pair-housing condition (intermittent: “IP”; continuous: “CP”) and observation period (midday, afternoon) on inactivity levels. Point size ranges from 1 to 16 observations. (B) Interaction between the current pairing condition and experimental group (CI, IC) on inactivity levels. Point size ranges from 1 to 17 observations.

