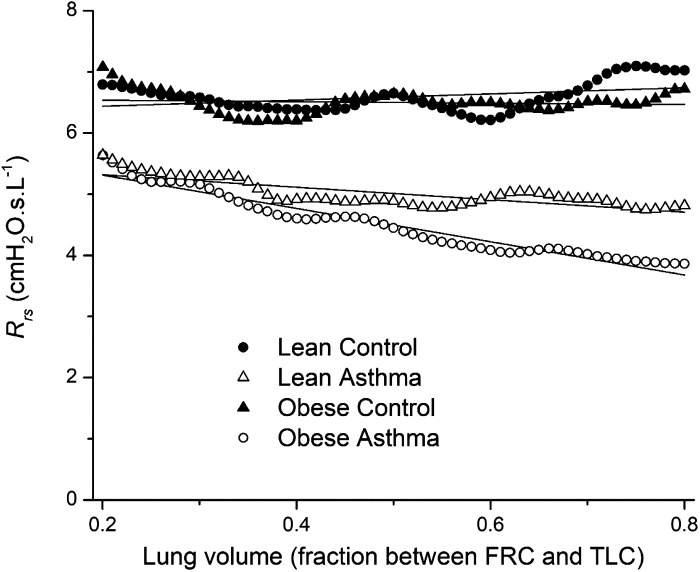
Fig. 3.
Respiratory system resistance (Rrs) versus fraction of lung volume between functional residual capacity (FRC) (0) and total lung capacity (TLC) (1.0). The symbols are mean values for each of the study groups between 20% and 80% of the volume range. Symbols represent the experimental measurements; solid lines are linear fits to each group. Linear regression analysis was used to determine that all slopes are significantly different (P < 0.05, Table 2).

