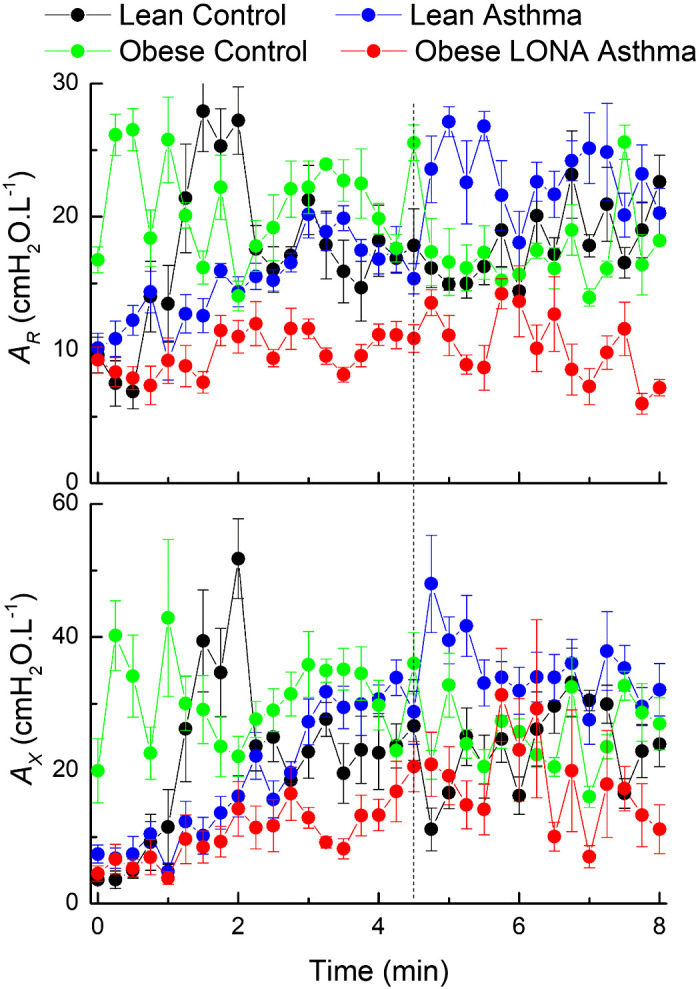
Fig 7.

Time courses for the areas AR and AX calculated from the fits provided by the 2-compartment model, as illustrated in Fig. 1 during aerosol methacholine challenge (0 to 4.5 min) and subsequently (4.5 to 8 min). The vertical dashed line indicates the time at which methacholine aerosolization was terminated. The data are presented as means ± SE. The slopes of AX versus time during challenge are significantly different between groups (ANOVA, P = 0.003), with the Lean Asthma slope greater than both Obese Control (P = 0.001) and late-onset nonallergic (LONA) (P = 0.045). The slopes of AX versus time were not different postchallenge.
