Figure 1.

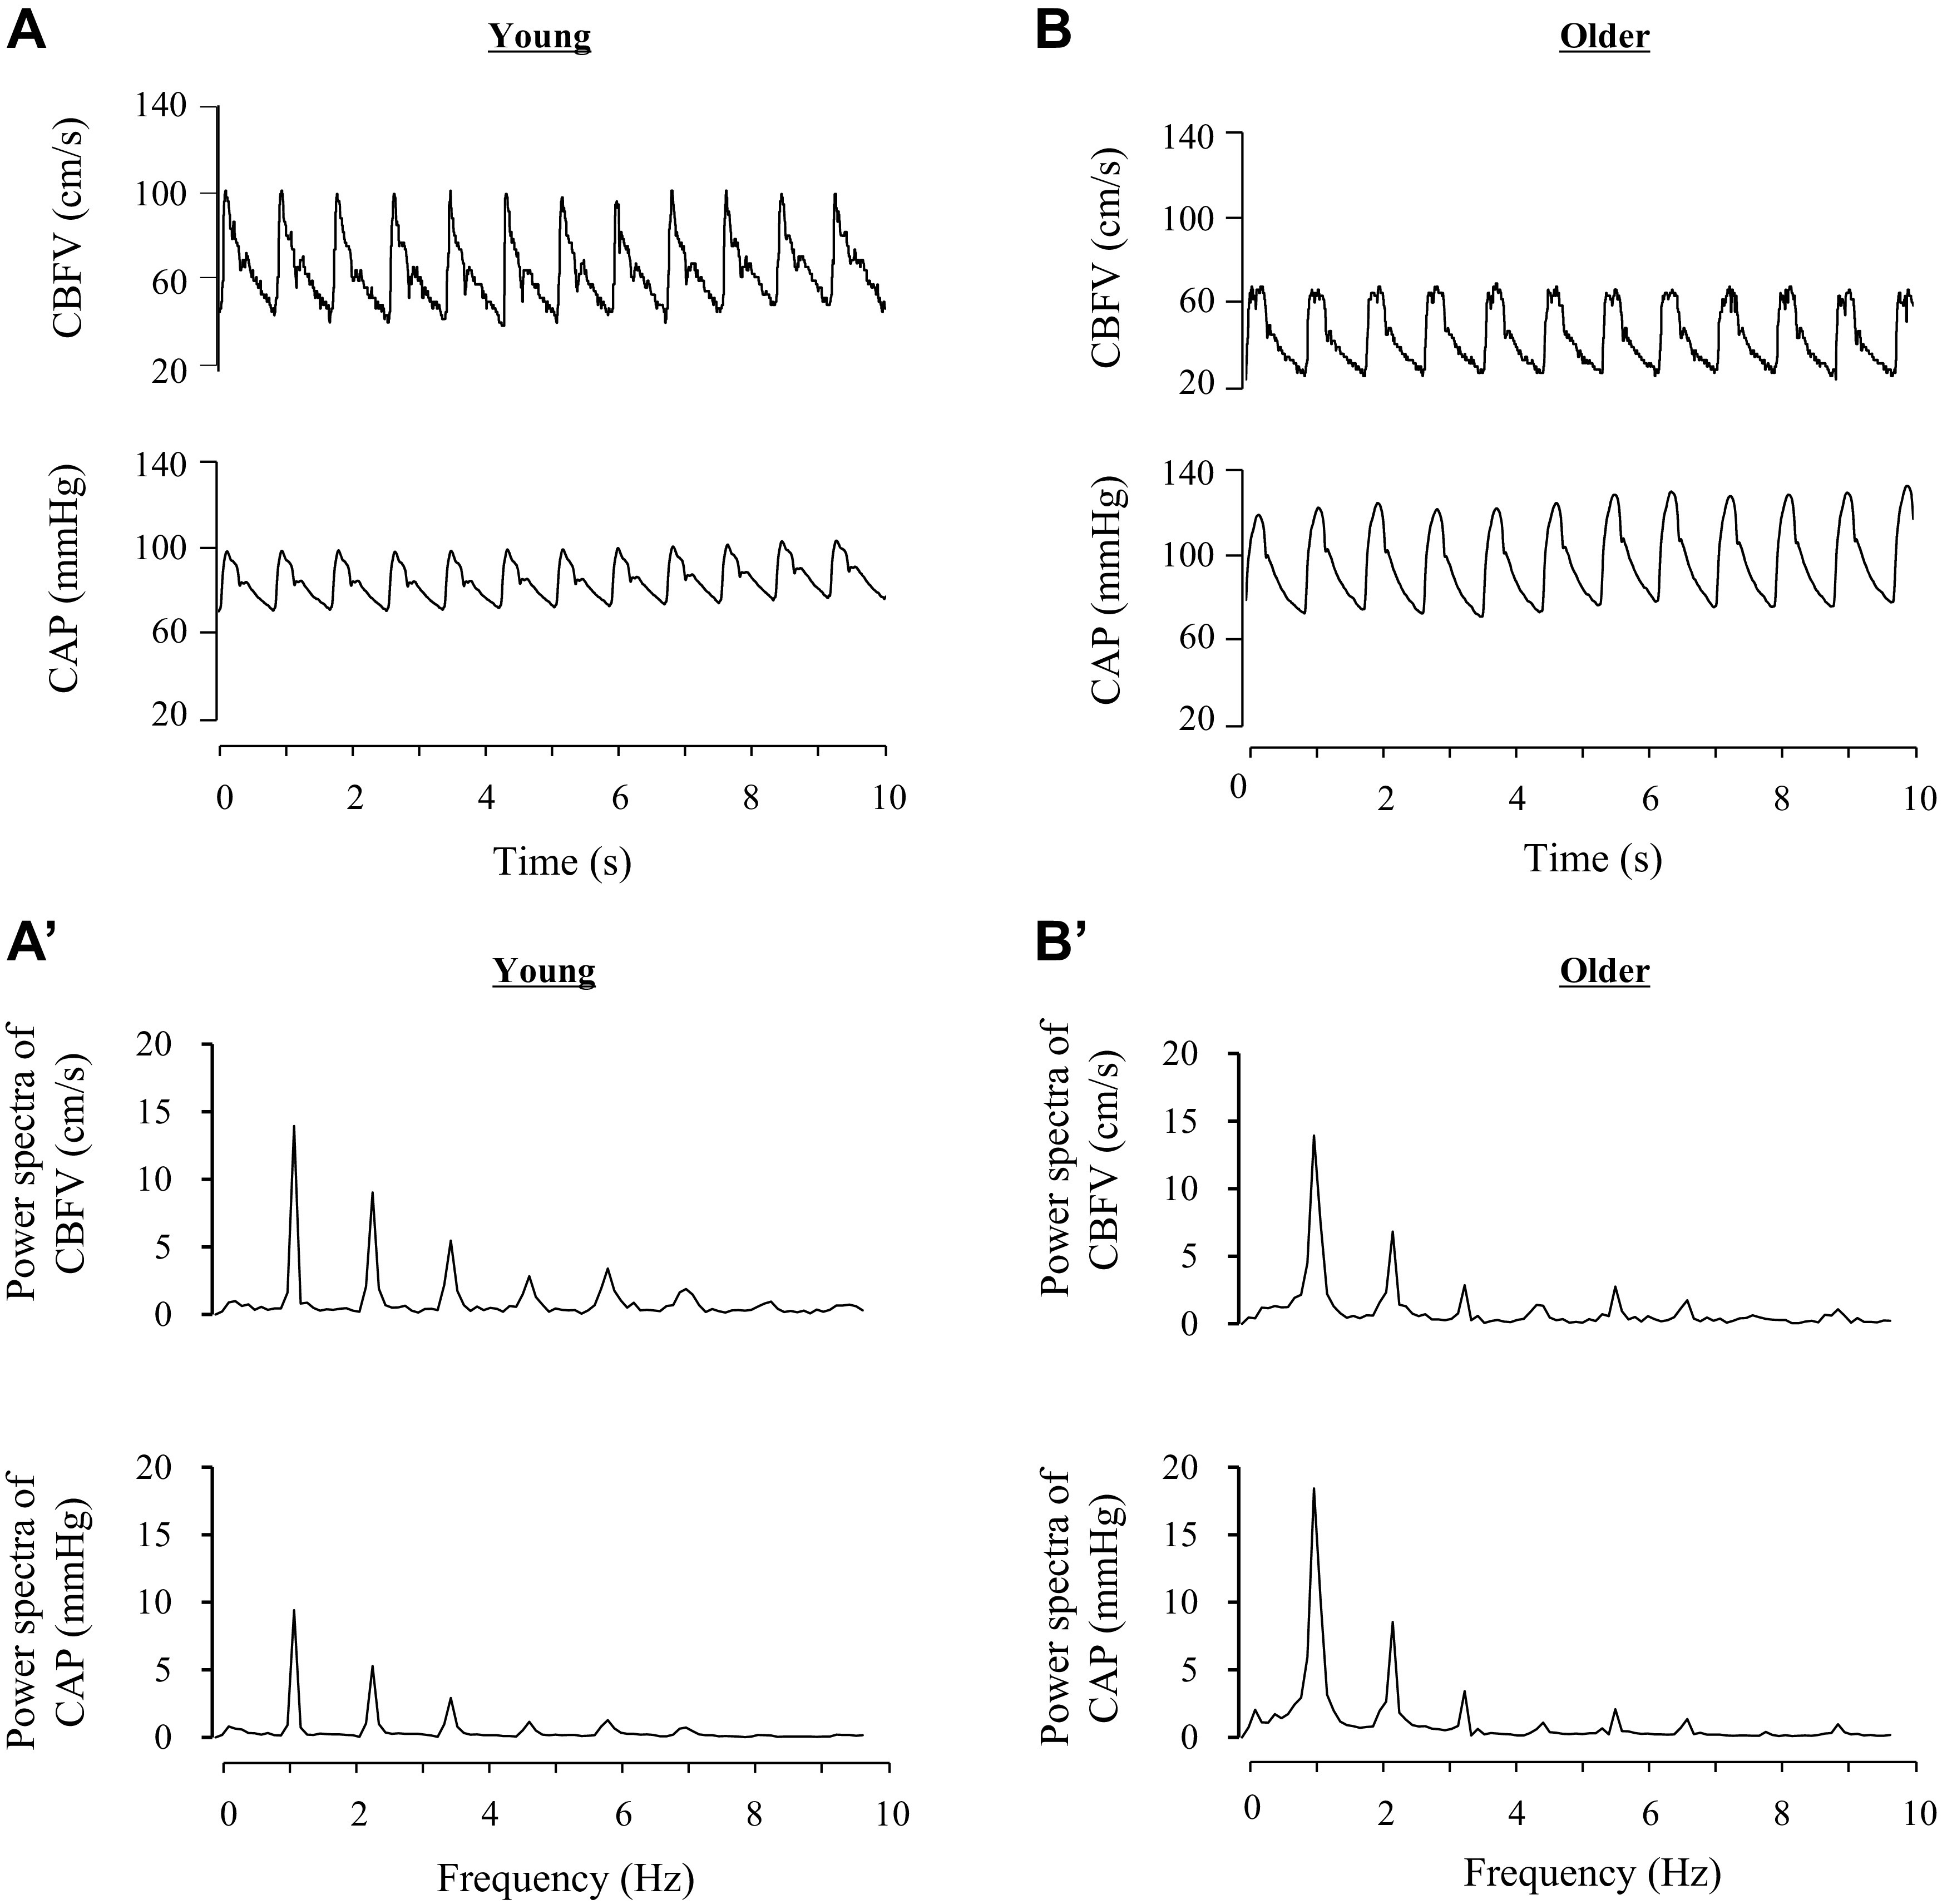
Representative data of cerebral blood flow velocity (CBFV) and carotid arterial pressure (CAP) in young (left) and older (right) individuals. A and B: time series of CBFV and CAP. A’ and B’: corresponding spectra of A and B.

Representative data of cerebral blood flow velocity (CBFV) and carotid arterial pressure (CAP) in young (left) and older (right) individuals. A and B: time series of CBFV and CAP. A’ and B’: corresponding spectra of A and B.