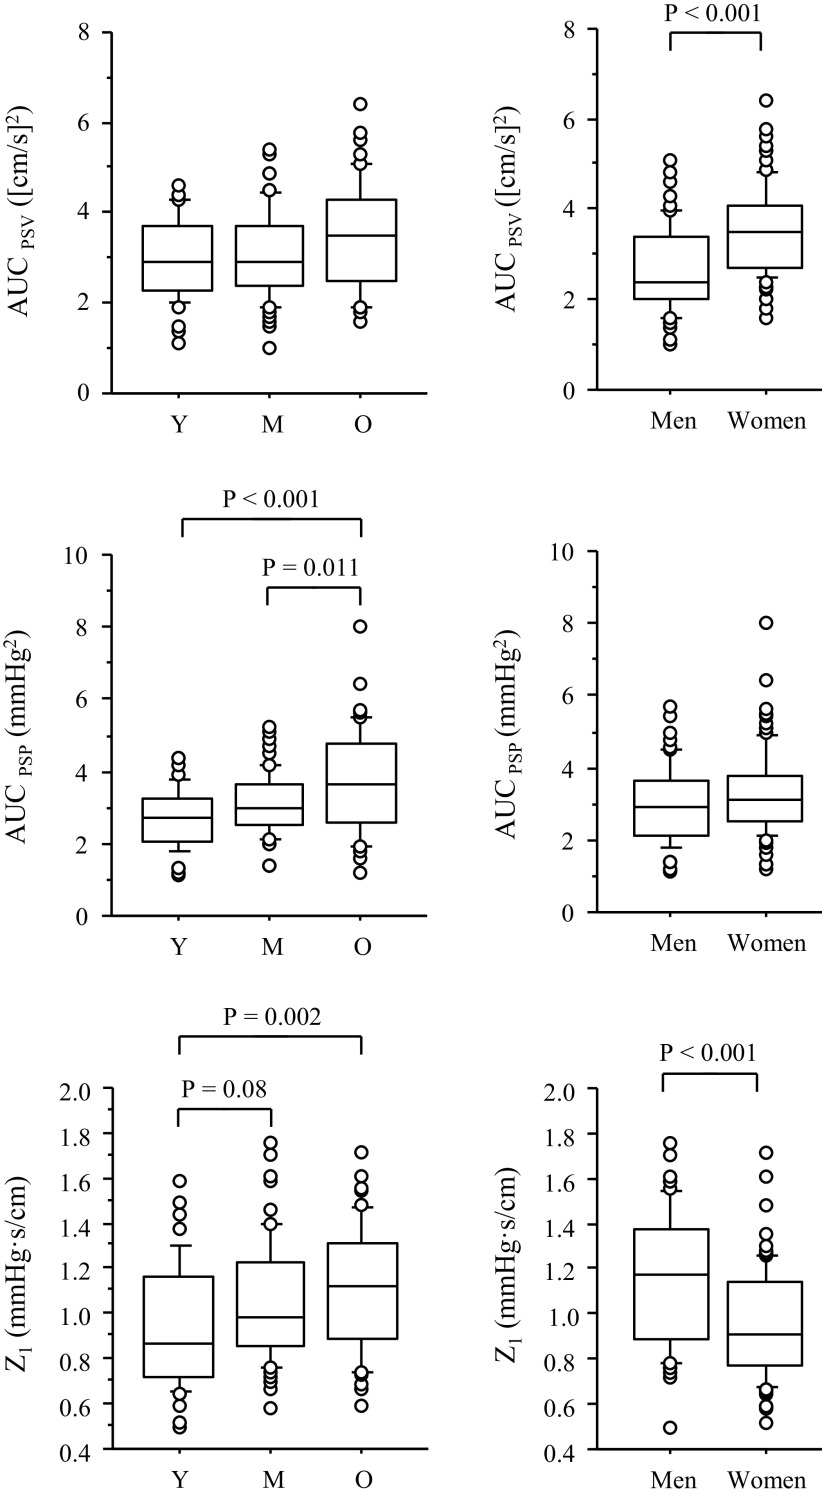
Figure 3.
The box-and-whisker plots of hemodynamic oscillation and the impedance modulus (Z1) at the first harmonic among age groups (left) and sex (right). AUCPSV and AUCPSP represent the spectral power of cerebral blood flow velocity and carotid arterial pressure oscillations in the frequency range of 0.78–1.56 Hz, respectively. Y, M, and O indicate young, middle age, and old, respectively.

