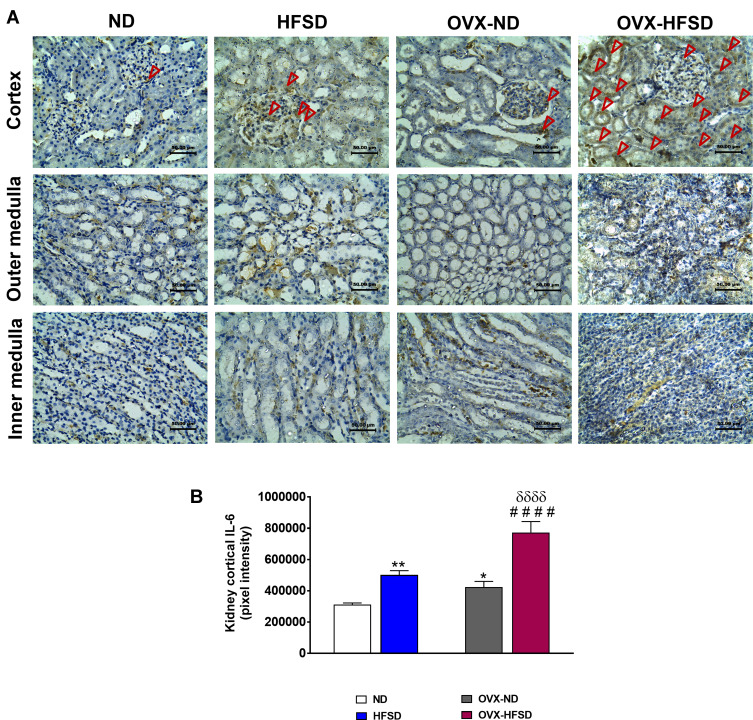
Figure 6.
Immunohistochemical staining of IL-6 in kidneys in the cortex, outer medulla and inner medulla regions (A) and quantification of mean pixel intensities of kidney cortical IL-6 staining (B) of normal diet (ND)- and high fat style diet (HFSD)-fed rats, with and without ovariectomy (OVX) (n = 12 per group) at 40X magnification. Dark red arrow indicates the positive immunohistochemical stainings. *P < 0.05 or **P < 0.01 vs. ND; ####P < 0.001 vs. OVX-ND; δδδδP < 0.001 vs. HFSD.

