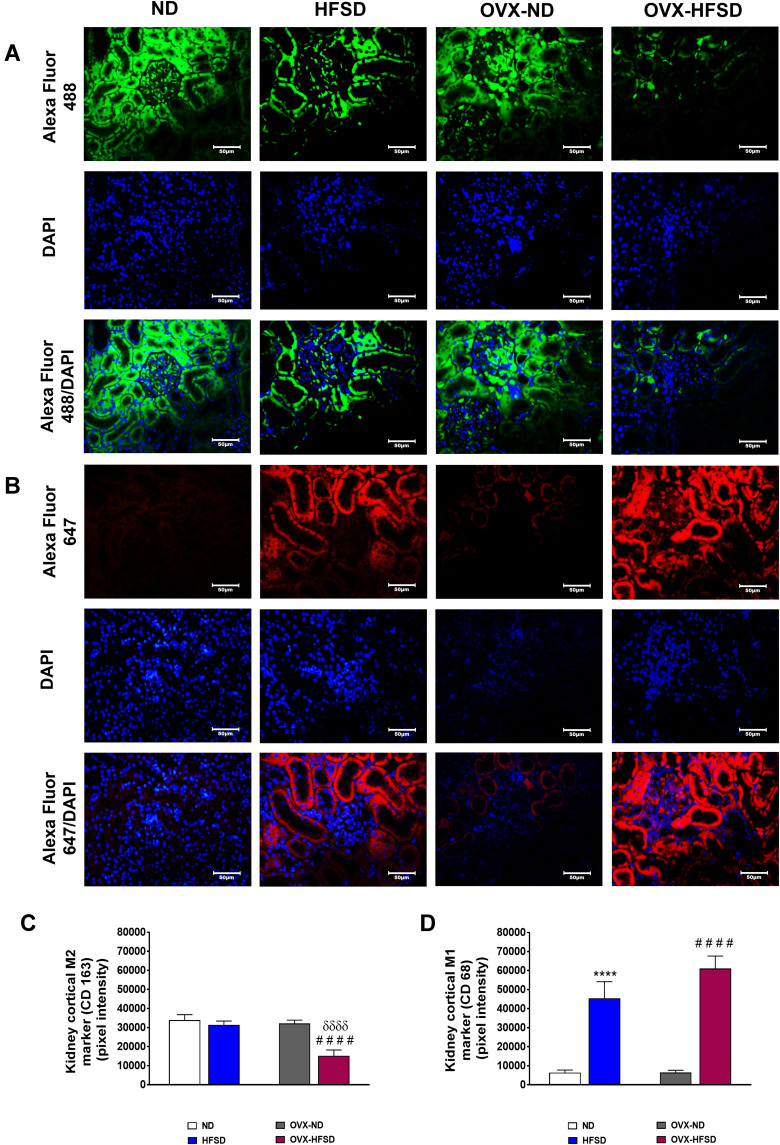
Figure 11.
Immunofluorescence staining of M1 (indicated in red color fluorescent) (A), M2 (indicated in green color fluorescent) (B) macrophages in kidneys, and quantification of mean pixel intensities of kidney cortical M1 (C) and M2 markers (D) of normal diet (ND)- and high fat style diet (HFSD)-fed rats, with and without ovariectomy (OVX) (n = 12 per group) at 40X magnification. ****P < 0.001 vs. ND; ####P < 0.001 vs. OVX-ND; δδδδP < 0.001 vs. HFSD.

