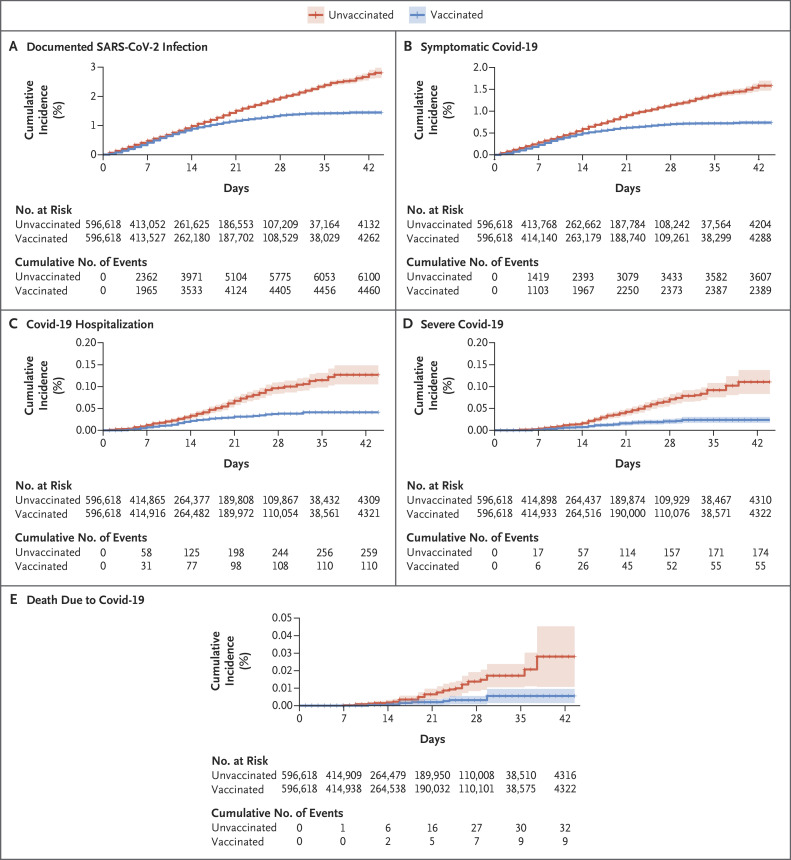
Figure 2. Cumulative Incidence of the Five Outcomes.
Cumulative incidence curves (1 minus the Kaplan–Meier risk) for the various outcomes are shown, starting from the day of administration of the first dose of vaccine. Shaded areas represent 95% confidence intervals. The number at risk at each time point and the cumulative number of events are also shown for each outcome. Graphs in which all data are shown with a y axis scale from 0 to 100 (along with the data shown, as here, on an expanded y axis) are provided in Figure S8 in the Supplementary Appendix.

