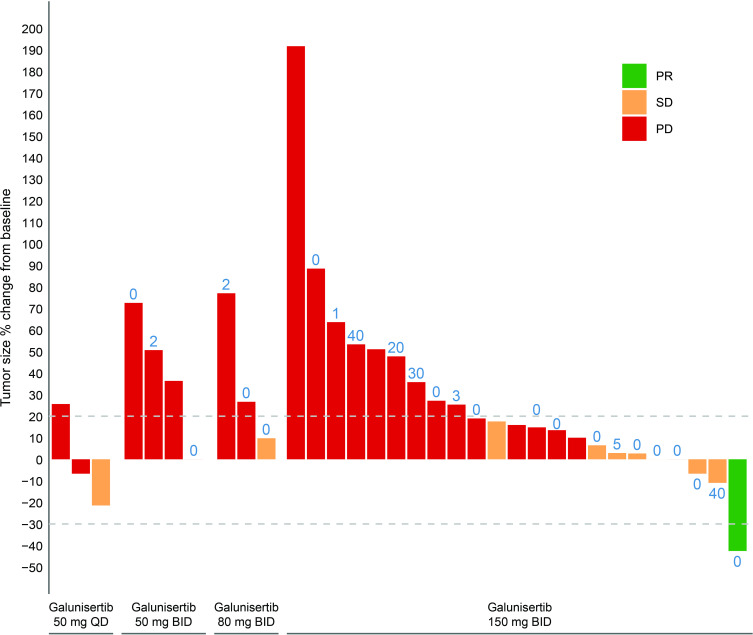
Figure 1.
Best response by patient based on change in tumor size. All treated patients with best overall response (n=33). Blue number=percentage of tumor cells at baseline with positive PD-L1 membrane staining. Dashed lines at –30% and 20% represent the thresholds for SD; neither an increase in size of more than 20% nor a decrease in size of more than 30% since the initial baseline measurement. BID, two times per day; PD, progressive disease; PD-L1, programmed death-ligand 1; PR, partial response; QD, one time per day; SD, stable disease.

