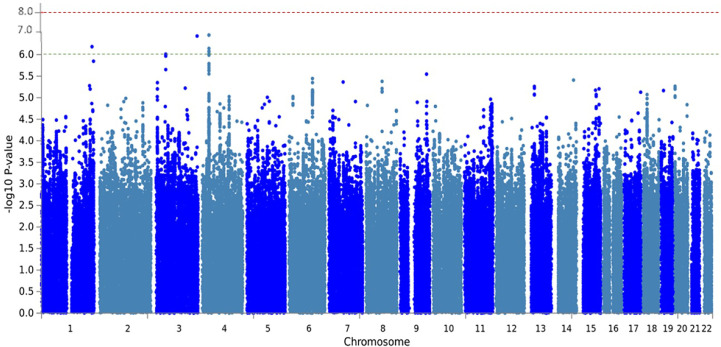
Figure 2.
Manhattan plot of meta-analysis GWAS with MPO-DNA levels of RS-I and RS-II. The Manhattan plot shows the statistical genetic association between SNPs and MPO-DNA complex levels. Each SNP is represented by a dot. Genomic coordinates are displayed along the x-axis and the negative log-base-10 of the p-value for each of the polymorphisms in the genome is displayed along the y-axis. The red line represents the genome-wide significance threshold (5 × 10⁻⁸). The SNPs with a suggestive association with MPO-DNA levels were annotated to the genes, KIF26B, CDK19, CATSPERB, AC027119.1.

