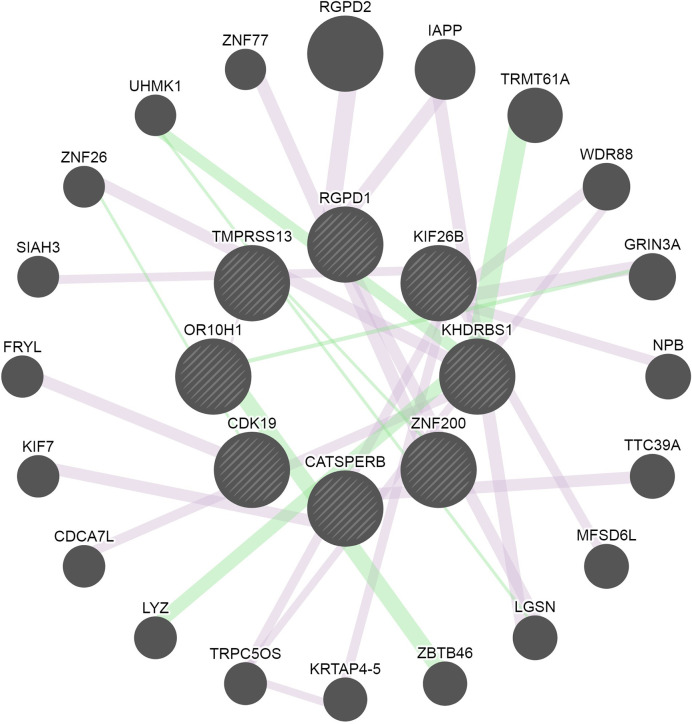
Figure 3.
Network of the connected genes identified through GWAS and exome-sequencing analyses. Eight of the identified genes were connected and are represented in the middle circle of the image. Additional genes associated with the genes found in this study are displayed in the outer area of the network circle. The pink lines represent the physical interaction reported by several studies. The green lines represent genetic interactions. The edges are annotated with the original edge weights (obtained from the source networks and relevant publications). The nodes are annotated with Gene Ontology terms, alternate identifiers and synonyms.

