
Fig. 2. CASP success rates versus difficulty of the target protein, over the years.
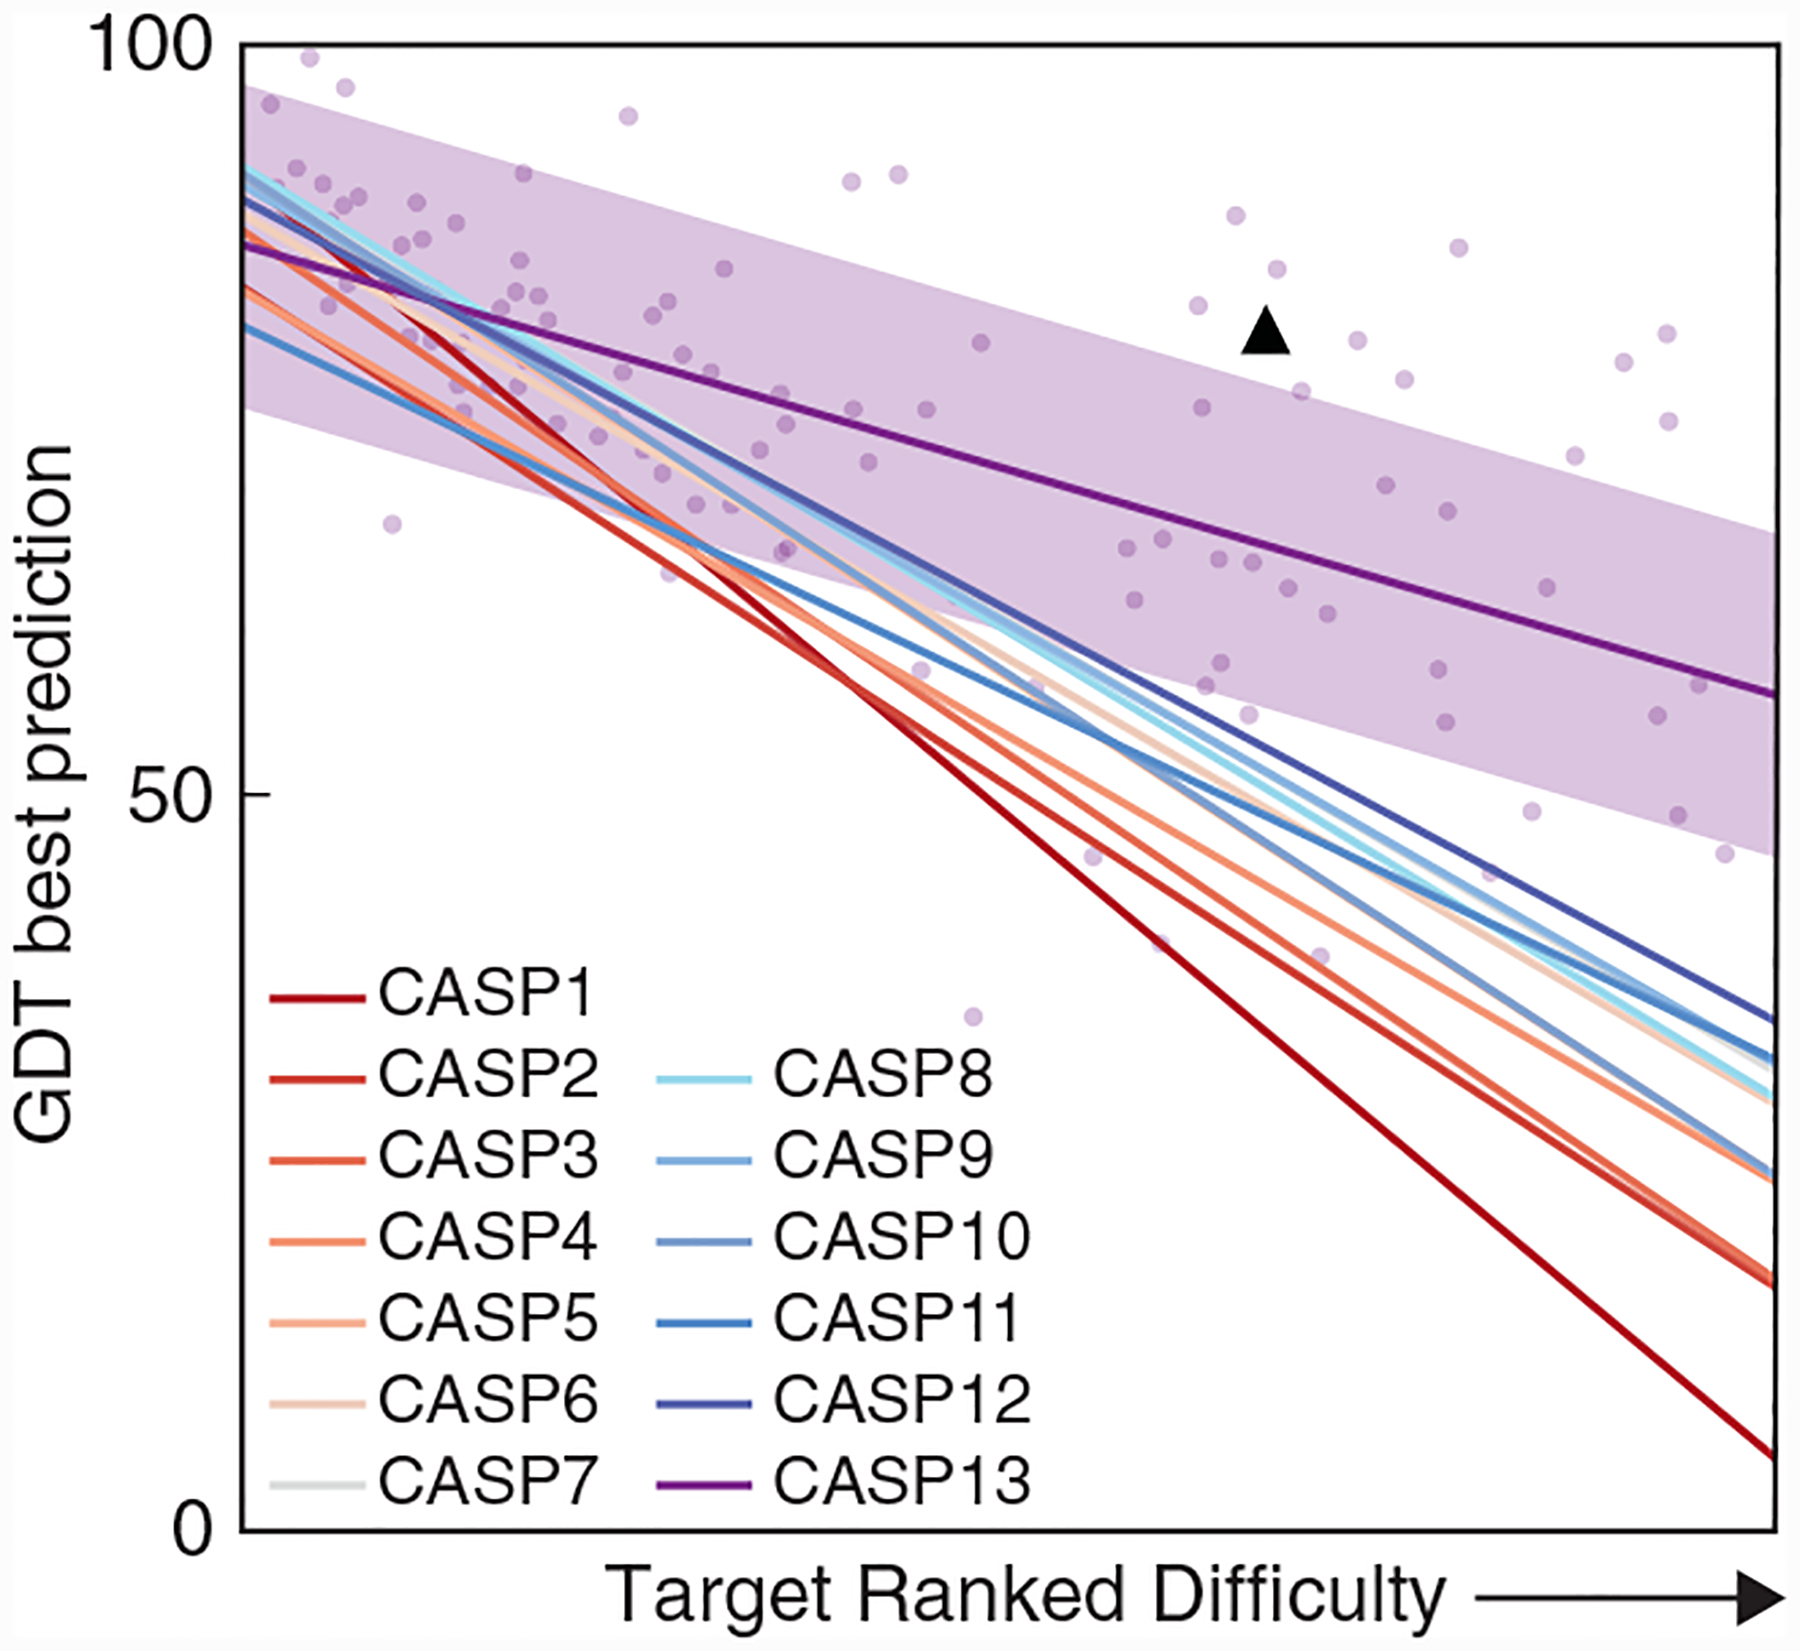
“Difficulty” is defined by how similar a template sequence that can be found in the PDB is to the target protein being predicted. Data points show the best predictions for each target protein in CASP 13; the purple shading shows the variance. Lines show the mean for each CASP. Main conclusions: (i) SBI requires good templates (all lines slope down). (ii) Predictions are improving over time (lines are higher in later events). (iii) Coevolutionary data and deep learning are adding value (step from CASP 12 to 13). (iv) CMP is now competitive in CASP (black triangle).