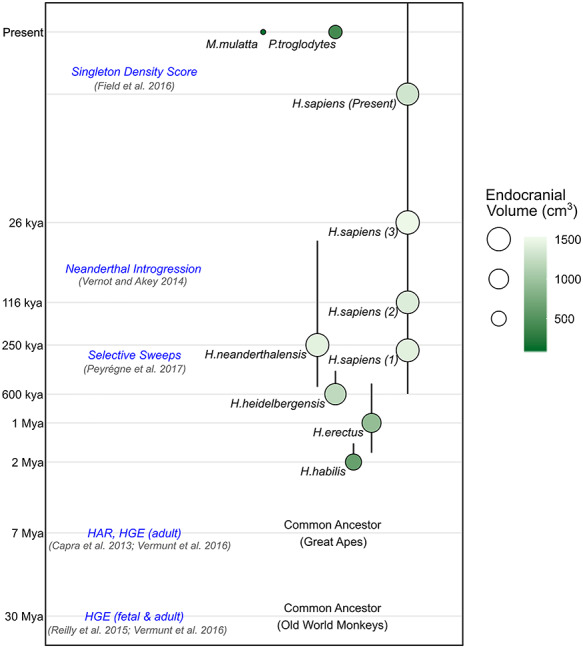
Figure 1.

Overview of human evolution and timeframes captured by different sets of analyses in this study. Size and shading of circles indicates average endocranial volume [H. habilis volume from Klein (2009), all other hominin volumes are averaged from Neubauer et al. (2018). P. troglodytes volume from Neubauer et al. (2012) and M. mulatta volume is an average from Isler et al. (2008)], and their vertical position indicates the age of the specimen [an average in the case of the Neubauer et al. (2018) hominin endocasts]. Numbers next to the H. sapiens circles indicate the geologic age group from Neubauer et al. (2018). Vertical lines reflect the approximate timeframe of the hominin species (right). Evolutionary time is presented in log10 scale (Mya, million years ago; kya, thousand years ago). Different types of evolutionary annotations are indicated, identifying genomic loci that underwent changes over different time frames (left, blue text). Horizontal spacing between species does not convey genetic distance, geological time, or any other metric.
