
Figure 5.
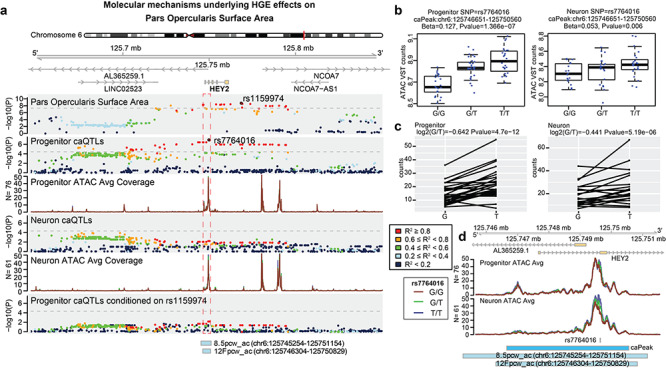
Fine mapping and molecular mechanisms underlying genetic variation at HGE associated with SA of pars opercularis in the inferior frontal gyrus. (a) Regional plots showing associations to pars opercularis SA, associations to the boxed chromatin accessibility peak in human neural progenitors, the average chromatin accessibility in progenitors, association to the boxed chromatin accessibility peak in differentiated neurons, the average chromatin accessibility in neurons, and an analysis demonstrating a co-localization through observation that controlling for the pars opercularis SA index SNP abolishes the progenitor caQTL signal. The y-axis on the nonshaded tracks represents chromatin accessibility as average normalized read density across ATAC-seq libraries for either neurons or progenitors. (b) Boxplots demonstrating the caQTL association observed in progenitors and neurons for the index caQTL SNP. (c) Allele specific chromatin accessibility is also observed at the same SNP. (d) Chromatin accessibility separated by genotype at the boxed peak in (a) overlapping the human-gained enhancer peaks. The blue bar represents the chromatin accessibility peak defined in this dataset and the gray bars represent human gained enhancer peaks. The y-axis again represents chromatin accessibility as average normalized read density across ATAC-seq libraries. Prior to ancestry regression, the SNP rs7764016 has association to pars opercularis SA with P = 2.1e−09. However, this SNP is not present in the 1000 Genomes Phase 3 data used for ancestry regression so is not present as a dot in (a).